|
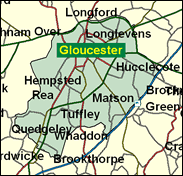
Gloucester
Labour hold

Tess Kingham has decided that one term is enough as an experience of the Commons. In her stead, Labour has selected a member of an even more under-represented group, the Asian Parmjit Dhanda, and this for a seat which is more than 94 per cent white. Mr Dhanda should be favourite to win next time, as long as Labour are granted a second governmental term, but in the long run Gloucester's marginal status will probably ensure more close contests, as the Conservatives certainly cannot be written off. In May 2000, for example, Tory candidates rather easily outpolled Labour's standard bearers in City of Gloucester elections.

With the disillusioned exit of Tess Kingham, a Blair's Babe who wanted to be able to see more of her children ("the hours are pointless and the Whips are bullies"), Labour have chosen Parmjit Dhanda, an Asian candidate, in a seat with a less than six per cent non-white population. Born 1971, educated at Mellow Lane Comprehensive School, Hayes, Middlesex, and with degrees in electronic engineering from Nottingham University, he is Assistant National Organiser of Connect - the union for IT workers. He has risen with the aid of USDAW, as a councillor in Hillingdon, as a former full time party agent in West London and Wiltshire, a Fabian, and a European Parliamentary candidate ranked five in Labour's list of 11 in the South East.One of only two non-white Labour candidates likely to be elected in addition to the present 10 black or Asian MPs, he has been dogged by local press claims that his candidacy is inappropriate in a 95% white seat and that anyway, as a Sikh, he is mismatched with local West Indians and Gujaratis.
 |
| Wealthy Achievers, Suburban Areas |
8.35% |
14.99% |
55.72 |
|
| Affluent Greys, Rural Communities |
0.00% |
2.13% |
0.00 |
|
| Prosperous Pensioners, Retirement Areas |
0.78% |
2.49% |
31.52 |
|
| Affluent Executives, Family Areas |
14.54% |
4.43% |
328.49 |
|
| Well-Off Workers, Family Areas |
11.56% |
7.27% |
158.89 |
|
| Affluent Urbanites, Town & City Areas |
1.11% |
2.56% |
43.19 |
|
| Prosperous Professionals, Metropolitan Areas |
0.00% |
2.04% |
0.00 |
|
| Better-Off Executives, Inner City Areas |
3.11% |
3.94% |
78.90 |
|
| Comfortable Middle Agers, Mature Home Owning Areas |
19.69% |
13.04% |
150.97 |
|
| Skilled Workers, Home Owning Areas |
16.78% |
12.70% |
132.07 |
|
| New Home Owners, Mature Communities |
7.81% |
8.14% |
95.93 |
|
| White Collar Workers, Better-Off Multi Ethnic Areas |
2.30% |
4.02% |
57.28 |
|
| Older People, Less Prosperous Areas |
2.41% |
3.19% |
75.51 |
|
| Council Estate Residents, Better-Off Homes |
9.25% |
11.31% |
81.79 |
|
| Council Estate Residents, High Unemployment |
1.72% |
3.06% |
56.28 |
|
| Council Estate Residents, Greatest Hardship |
0.57% |
2.52% |
22.82 |
|
| People in Multi-Ethnic, Low-Income Areas |
0.00% |
2.10% |
0.00 |
|
| Unclassified |
0.02% |
0.06% |
29.13 |
|
|
 |
 |
 |
| £0-5K |
9.33% |
9.41% |
99.08 |
|
| £5-10K |
17.31% |
16.63% |
104.07 |
|
| £10-15K |
17.84% |
16.58% |
107.60 |
|
| £15-20K |
14.72% |
13.58% |
108.34 |
|
| £20-25K |
11.10% |
10.39% |
106.84 |
|
| £25-30K |
8.07% |
7.77% |
103.86 |
|
| £30-35K |
5.79% |
5.79% |
99.99 |
|
| £35-40K |
4.14% |
4.33% |
95.65 |
|
| £40-45K |
2.98% |
3.27% |
91.14 |
|
| £45-50K |
2.15% |
2.48% |
86.64 |
|
| £50-55K |
1.57% |
1.90% |
82.26 |
|
| £55-60K |
1.15% |
1.47% |
78.08 |
|
| £60-65K |
0.85% |
1.15% |
74.13 |
|
| £65-70K |
0.64% |
0.91% |
70.43 |
|
| £70-75K |
0.48% |
0.72% |
66.98 |
|
| £75-80K |
0.37% |
0.57% |
63.78 |
|
| £80-85K |
0.28% |
0.46% |
60.82 |
|
| £85-90K |
0.22% |
0.37% |
58.07 |
|
| £90-95K |
0.17% |
0.31% |
55.54 |
|
| £95-100K |
0.13% |
0.25% |
53.20 |
|
| £100K + |
0.57% |
1.34% |
42.64 |
|
|
|

|


|
1992-1997
|
1997-2001
|
|
|
|
| Con |
-9.78% |
| Lab |
13.18% |
| LD |
-7.12% |
|
| Con |
2.00% |
| Lab |
-4.22% |
| LD |
3.78% |
|
|
 |
Parmjit Dhanda
Labour hold
|
| Con |
 |
18,187 |
37.71% |
| Lab |
 |
22,067 |
45.76% |
| LD |
 |
6,875 |
14.26% |
| Oth |
 |
1,094 |
2.27% |
| Maj |
 |
3,880 |
8.05% |
| Turn |
 |
48,223 |
59.43% |
|
|
 |
Parmjit Dhanda
Labour hold
|
| LD |
Tim Bullamore |
6,875 |
14.26% |
| L |
Parmjit Dhanda |
22,067 |
45.76% |
| C |
Paul James |
18,187 |
37.71% |
| UK |
Terry Lines |
822 |
1.70% |
| SA |
Stewart Smyth |
272 |
0.56% |
|
Candidates representing 5 parties stood for election to this seat.
|
|
 |
Tess Kingham
Labour gain
|
| Con |
 |
20,684 |
35.72% |
| Lab |
 |
28,943 |
49.98% |
| LD |
 |
6,069 |
10.48% |
| Ref |
 |
1,482 |
2.56% |
| Oth |
 |
736 |
1.27% |
| Maj |
 |
8,259 |
14.26% |
| Turn |
 |
57,914 |
73.61% |
|
|
 |
|
Conservative
|
| Con |
 |
28,274 |
45.50% |
| Lab |
 |
22,867 |
36.80% |
| LD |
 |
10,961 |
17.60% |
| Oth |
|
0 |
0.00% |
| Maj |
 |
5,407 |
8.70% |
| Turn |
 |
62,102 |
81.19% |
|
|
 |
|

|

