|
Gordon
Liberal Democrat hold

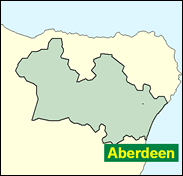
Gordon in north east Scotland has for some time looked like a safe Liberal Democrat seat, despite its (almost certainly incorrect) allocation to the Conservatives by the team of academics creating notional, or imaginary, results for the 1992 election on the boundaries which came into force in 1997. Malcolm Bruce won by a margin of more than 16 per cent of the total vote in the 1997 General Election, and Nora Radcliffe won by more than 12 per cent from the SNP with the Tories down to third in the Scottish Parliament election of 1999. Bruce may well even increase his majority next time in one of Scotland's larger electorates, even though he has probably not benefited from the 1997 removal of some thousands of suburban Aberdeen voters now that city has three seats under its own name. The new Gordon is more rural, the latest centres of population being small burghs like Inverurie, Keith, Huntly and Turriff, and including the farmland of the valleys of many rivers like the Don, the Elleron, the Bogie and the Ythan (names to conjure with). But that seems to hold few fears for the resilient Malcolm Bruce.

Malcolm Bruce, elected here in 1983, has been leader of the Scottish Liberals and Treasury spokesman, but under Charles Kennedy's leadership he has the rather non-job of Chairman of the Parliamentary Party. A short man with a Scottish name, he actually comes from Birkenhead (born 1944) and attended Wrekin College, Shropshire, arriving in Scotland in order to attend St Andrew's University. A former journalist, initially on the Liverpool Daily Post and then on oil-industry-related publications in Aberdeen, he retrained as a barrister in 1995 as an insurance against losing his wobbly seat. He is of the Liberal faction that avoids Lib-Labbery, worried about the Conservative origins of many of his Gordon votes.
 |
| Wealthy Achievers, Suburban Areas |
10.70% |
14.99% |
71.36 |
|
| Affluent Greys, Rural Communities |
14.14% |
2.13% |
664.79 |
|
| Prosperous Pensioners, Retirement Areas |
0.68% |
2.49% |
27.27 |
|
| Affluent Executives, Family Areas |
15.41% |
4.43% |
348.13 |
|
| Well-Off Workers, Family Areas |
14.01% |
7.27% |
192.56 |
|
| Affluent Urbanites, Town & City Areas |
2.31% |
2.56% |
90.00 |
|
| Prosperous Professionals, Metropolitan Areas |
0.01% |
2.04% |
0.52 |
|
| Better-Off Executives, Inner City Areas |
0.30% |
3.94% |
7.69 |
|
| Comfortable Middle Agers, Mature Home Owning Areas |
10.10% |
13.04% |
77.48 |
|
| Skilled Workers, Home Owning Areas |
4.19% |
12.70% |
32.95 |
|
| New Home Owners, Mature Communities |
10.45% |
8.14% |
128.31 |
|
| White Collar Workers, Better-Off Multi Ethnic Areas |
0.48% |
4.02% |
12.00 |
|
| Older People, Less Prosperous Areas |
6.67% |
3.19% |
209.51 |
|
| Council Estate Residents, Better-Off Homes |
8.24% |
11.31% |
72.89 |
|
| Council Estate Residents, High Unemployment |
1.28% |
3.06% |
41.82 |
|
| Council Estate Residents, Greatest Hardship |
1.04% |
2.52% |
41.11 |
|
| People in Multi-Ethnic, Low-Income Areas |
0.00% |
2.10% |
0.00 |
|
| Unclassified |
0.00% |
0.06% |
0.00 |
|
|
 |
|
|
| £0-5K |
6.69% |
9.41% |
71.02 |
|
| £5-10K |
13.22% |
16.63% |
79.50 |
|
| £10-15K |
14.76% |
16.58% |
89.01 |
|
| £15-20K |
13.31% |
13.58% |
98.02 |
|
| £20-25K |
11.01% |
10.39% |
105.90 |
|
| £25-30K |
8.75% |
7.77% |
112.52 |
|
| £30-35K |
6.83% |
5.79% |
117.96 |
|
| £35-40K |
5.30% |
4.33% |
122.34 |
|
| £40-45K |
4.11% |
3.27% |
125.82 |
|
| £45-50K |
3.19% |
2.48% |
128.54 |
|
| £50-55K |
2.49% |
1.90% |
130.65 |
|
| £55-60K |
1.95% |
1.47% |
132.24 |
|
| £60-65K |
1.54% |
1.15% |
133.41 |
|
| £65-70K |
1.22% |
0.91% |
134.24 |
|
| £70-75K |
0.97% |
0.72% |
134.79 |
|
| £75-80K |
0.78% |
0.57% |
135.12 |
|
| £80-85K |
0.63% |
0.46% |
135.25 |
|
| £85-90K |
0.51% |
0.37% |
135.24 |
|
| £90-95K |
0.41% |
0.31% |
135.11 |
|
| £95-100K |
0.34% |
0.25% |
134.87 |
|
| £100K + |
1.76% |
1.34% |
131.17 |
|
|
|
|


|
1992-1997
|
1997-2001
|
|
|
|
| Con |
-21.96% |
| Lab |
4.00% |
| LD |
15.41% |
| SNP |
1.37% |
|
| Con |
-3.05% |
| Lab |
3.22% |
| LD |
2.90% |
| SNP |
-3.51% |
|
|
|
Malcolm Bruce
Liberal Democrat hold
|
| Con |
 |
8,049 |
23.00% |
| Lab |
 |
4,730 |
13.51% |
| LD |
 |
15,928 |
45.51% |
| SNP |
 |
5,760 |
16.46% |
| Oth |
 |
534 |
1.53% |
| Maj |
 |
7,879 |
22.51% |
| Turn |
|
35,001 |
58.34% |
|
|
|
Malcolm Bruce
Liberal Democrat hold
|
| LD |
Malcolm Bruce |
15,928 |
45.51% |
| SNP |
Rhona Kemp |
5,760 |
16.46% |
| C |
Nanette Milne |
8,049 |
23.00% |
| SSP |
John Sangster |
534 |
1.53% |
| L |
Ellis Thorpe |
4,730 |
13.51% |
|
Candidates representing 5 parties stood for election to this seat.
|
|
|
Malcolm Bruce
Liberal Democrat
|
| Con |
|
11,002 |
26.04% |
| Lab |
|
4,350 |
10.30% |
| LD |
|
17,999 |
42.61% |
| SNP |
|
8,435 |
19.97% |
| Ref |
 |
459 |
1.09% |
| Oth |
|
0 |
0.00% |
| Maj |
|
6,997 |
16.56% |
| Turn |
|
42,245 |
71.89% |
|
|
|
|
Liberal Democrat
|
| Con |
|
19,596 |
48.00% |
| Lab |
|
2,561 |
6.30% |
| LD |
|
11,110 |
27.20% |
| SNP |
|
7,593 |
18.60% |
| Oth |
|
0 |
0.00% |
| Maj |
|
8,486 |
20.80% |
| Turn |
|
40,860 |
72.04% |
|
|
|
|
|