|
Gosport
Conservative hold

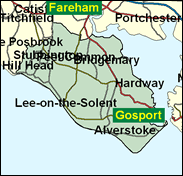
South Hampshire is a rapidly expanding area, but Gosport is a compact, geographically confined and self-contained town on a peninsula over the harbour from Portsmouth, with which it shares a naval and Right-wing tradition, which belies its working class socio-economic structure: it has one of the lowest percentages of professional and managerial workers of any Conservative constituency - only 25 per cent. Unlike Portsmouth though, Gosport remained strongly in the Tory ranks even in 1997 and it looks even more like an aberrant seat now: working class but not Left-wing, or even centrist, densely populated with almost no rural element, resistant to the new appeal of New Labour.

Peter Viggers is a fading, locally born (1938) company solicitor and Lloyds underwriter, educated at Portsmouth Grammar School and Trinity College Cambridge, who nearly drowned in a sailing accident in 1993 but thought of John Major. He was elected here in 1974, and spent three years as a Northern Ireland Minister in the eighties. Since then he has concentrated on defence-related issues without being gung ho, for example on Serbia and Kosovo, where he feared British casualties. Paradoxically a Thatcherite who was also pro-European, he claims to have sung every part in Handel's Messiah and was overdue for a knighthood when the Tories lost office in 1997.
 |
| Wealthy Achievers, Suburban Areas |
11.81% |
14.99% |
78.76 |
|
| Affluent Greys, Rural Communities |
0.00% |
2.13% |
0.00 |
|
| Prosperous Pensioners, Retirement Areas |
5.67% |
2.49% |
227.90 |
|
| Affluent Executives, Family Areas |
8.40% |
4.43% |
189.75 |
|
| Well-Off Workers, Family Areas |
9.85% |
7.27% |
135.41 |
|
| Affluent Urbanites, Town & City Areas |
2.68% |
2.56% |
104.49 |
|
| Prosperous Professionals, Metropolitan Areas |
0.00% |
2.04% |
0.00 |
|
| Better-Off Executives, Inner City Areas |
0.00% |
3.94% |
0.00 |
|
| Comfortable Middle Agers, Mature Home Owning Areas |
8.61% |
13.04% |
66.07 |
|
| Skilled Workers, Home Owning Areas |
27.11% |
12.70% |
213.44 |
|
| New Home Owners, Mature Communities |
7.91% |
8.14% |
97.14 |
|
| White Collar Workers, Better-Off Multi Ethnic Areas |
0.27% |
4.02% |
6.61 |
|
| Older People, Less Prosperous Areas |
2.67% |
3.19% |
83.92 |
|
| Council Estate Residents, Better-Off Homes |
10.43% |
11.31% |
92.20 |
|
| Council Estate Residents, High Unemployment |
2.00% |
3.06% |
65.37 |
|
| Council Estate Residents, Greatest Hardship |
2.51% |
2.52% |
99.71 |
|
| People in Multi-Ethnic, Low-Income Areas |
0.00% |
2.10% |
0.00 |
|
| Unclassified |
0.08% |
0.06% |
130.85 |
|
|
 |
 |
 |
| £0-5K |
8.42% |
9.41% |
89.41 |
|
| £5-10K |
17.18% |
16.63% |
103.28 |
|
| £10-15K |
18.28% |
16.58% |
110.27 |
|
| £15-20K |
15.17% |
13.58% |
111.70 |
|
| £20-25K |
11.36% |
10.39% |
109.33 |
|
| £25-30K |
8.15% |
7.77% |
104.84 |
|
| £30-35K |
5.76% |
5.79% |
99.41 |
|
| £35-40K |
4.06% |
4.33% |
93.74 |
|
| £40-45K |
2.88% |
3.27% |
88.23 |
|
| £45-50K |
2.06% |
2.48% |
83.08 |
|
| £50-55K |
1.49% |
1.90% |
78.35 |
|
| £55-60K |
1.09% |
1.47% |
74.06 |
|
| £60-65K |
0.81% |
1.15% |
70.19 |
|
| £65-70K |
0.60% |
0.91% |
66.71 |
|
| £70-75K |
0.46% |
0.72% |
63.57 |
|
| £75-80K |
0.35% |
0.57% |
60.74 |
|
| £80-85K |
0.27% |
0.46% |
58.19 |
|
| £85-90K |
0.21% |
0.37% |
55.87 |
|
| £90-95K |
0.16% |
0.31% |
53.77 |
|
| £95-100K |
0.13% |
0.25% |
51.85 |
|
| £100K + |
0.58% |
1.34% |
43.22 |
|
|
|

|


|
1992-1997
|
1997-2001
|
|
|
|
| Con |
-14.50% |
| Lab |
17.06% |
| LD |
-8.00% |
|
| Con |
0.04% |
| Lab |
6.39% |
| LD |
-4.50% |
|
|
 |
Peter Viggers
Conservative hold
|
| Con |
 |
17,364 |
43.64% |
| Lab |
 |
14,743 |
37.05% |
| LD |
 |
6,011 |
15.11% |
| Oth |
 |
1,671 |
4.20% |
| Maj |
 |
2,621 |
6.59% |
| Turn |
 |
39,789 |
57.15% |
|
|
 |
Peter Viggers
Conservative hold
|
| UK |
John Bowles |
1,162 |
2.92% |
| SL |
Kevin Chetwynd |
509 |
1.28% |
| LD |
Roger Roberts |
6,011 |
15.11% |
| C |
Peter Viggers |
17,364 |
43.64% |
| L |
Richard Williams |
14,743 |
37.05% |
|
Candidates representing 5 parties stood for election to this seat.
|
|
 |
Peter Viggers
Conservative
|
| Con |
 |
21,085 |
43.60% |
| Lab |
 |
14,827 |
30.66% |
| LD |
 |
9,479 |
19.60% |
| Ref |
 |
2,538 |
5.25% |
| Oth |
 |
426 |
0.88% |
| Maj |
 |
6,258 |
12.94% |
| Turn |
 |
48,355 |
70.25% |
|
|
 |
|
Conservative
|
| Con |
 |
31,094 |
58.10% |
| Lab |
 |
7,275 |
13.60% |
| LD |
 |
14,776 |
27.60% |
| Oth |
 |
332 |
0.60% |
| Maj |
 |
16,318 |
30.50% |
| Turn |
 |
53,477 |
76.55% |
|
|
 |
|

|

