|
Gower
Labour hold

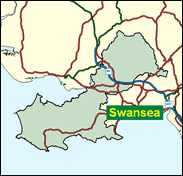
The Gower peninsula, with its attractive seaside villages and plethora of sandy beaches, may give its name to this constituency but not it does not set its political tone, which comes from the working class and ancestrally Labour ex-coal mining valleys on the other side of Swansea, round which this seat curls like a kidney. Gorseinon and Pontardulais and Pontardawe are more typical than the Mumbles or Langland Bay. Through the 20th Century Gower was actually one of Labour's most reliable constituencies, and there is little reason for this to change in the 21st.

Martin Caton, a bearded former political assistant to a local MEP, and earlier a scientific officer at a plant breeding station in Aberystwyth, was elected here in 1997. English-born (1951) and educated at Newport Grammar School, Essex, and Norfolk School of Agriculture, he arrived in Wales as a student at Aberystwyth College of Further Education. Not without a certain wit, he wondered in a debate on sustainable development if there were "theories at the bottom of your jargon", and perhaps dangerously dubbed his constituents "Jerks" for being half-way between people in Llanelli (known as 'Turks') and Swansea (known as 'Jacks'). He has been moderately rebellious on lone parent benefit cuts, the Prime Minister's power to nominate life peers, the pensions link to average earnings and means testing of incapacity benefit.
 |
| Wealthy Achievers, Suburban Areas |
32.37% |
14.99% |
215.92 |
|
| Affluent Greys, Rural Communities |
2.81% |
2.13% |
132.00 |
|
| Prosperous Pensioners, Retirement Areas |
3.87% |
2.49% |
155.72 |
|
| Affluent Executives, Family Areas |
3.01% |
4.43% |
68.05 |
|
| Well-Off Workers, Family Areas |
5.79% |
7.27% |
79.66 |
|
| Affluent Urbanites, Town & City Areas |
2.01% |
2.56% |
78.33 |
|
| Prosperous Professionals, Metropolitan Areas |
0.02% |
2.04% |
0.85 |
|
| Better-Off Executives, Inner City Areas |
0.00% |
3.94% |
0.00 |
|
| Comfortable Middle Agers, Mature Home Owning Areas |
24.17% |
13.04% |
185.37 |
|
| Skilled Workers, Home Owning Areas |
5.84% |
12.70% |
45.98 |
|
| New Home Owners, Mature Communities |
12.40% |
8.14% |
152.29 |
|
| White Collar Workers, Better-Off Multi Ethnic Areas |
0.90% |
4.02% |
22.41 |
|
| Older People, Less Prosperous Areas |
2.71% |
3.19% |
85.23 |
|
| Council Estate Residents, Better-Off Homes |
3.40% |
11.31% |
30.07 |
|
| Council Estate Residents, High Unemployment |
0.06% |
3.06% |
1.95 |
|
| Council Estate Residents, Greatest Hardship |
0.63% |
2.52% |
24.92 |
|
| People in Multi-Ethnic, Low-Income Areas |
0.00% |
2.10% |
0.00 |
|
| Unclassified |
0.00% |
0.06% |
0.00 |
|
|
 |
 |
 |
| £0-5K |
8.13% |
9.41% |
86.34 |
|
| £5-10K |
15.99% |
16.63% |
96.11 |
|
| £10-15K |
16.96% |
16.58% |
102.32 |
|
| £15-20K |
14.34% |
13.58% |
105.54 |
|
| £20-25K |
11.09% |
10.39% |
106.69 |
|
| £25-30K |
8.28% |
7.77% |
106.50 |
|
| £30-35K |
6.11% |
5.79% |
105.47 |
|
| £35-40K |
4.50% |
4.33% |
103.95 |
|
| £40-45K |
3.34% |
3.27% |
102.15 |
|
| £45-50K |
2.49% |
2.48% |
100.21 |
|
| £50-55K |
1.87% |
1.90% |
98.23 |
|
| £55-60K |
1.42% |
1.47% |
96.24 |
|
| £60-65K |
1.09% |
1.15% |
94.30 |
|
| £65-70K |
0.84% |
0.91% |
92.41 |
|
| £70-75K |
0.65% |
0.72% |
90.60 |
|
| £75-80K |
0.51% |
0.57% |
88.86 |
|
| £80-85K |
0.40% |
0.46% |
87.20 |
|
| £85-90K |
0.32% |
0.37% |
85.61 |
|
| £90-95K |
0.26% |
0.31% |
84.09 |
|
| £95-100K |
0.21% |
0.25% |
82.64 |
|
| £100K + |
1.00% |
1.34% |
74.64 |
|
|
|

|


|
1992-1997
|
1997-2001
|
|
|
|
| Con |
-11.32% |
| Lab |
3.70% |
| LD |
3.08% |
| PC |
1.64% |
|
| Con |
1.03% |
| Lab |
-11.14% |
| LD |
-2.10% |
| PC |
4.19% |
|
|
 |
Martin Caton
Labour hold
|
| Con |
 |
10,281 |
24.81% |
| Lab |
 |
17,676 |
42.65% |
| LD |
 |
4,507 |
10.88% |
| PC |
 |
3,865 |
9.33% |
| Oth |
 |
5,114 |
12.34% |
| Maj |
 |
7,395 |
17.84% |
| Turn |
 |
41,443 |
70.31% |
|
|
 |
Martin Caton
Labour hold
|
| C |
John Bushell |
10,281 |
24.81% |
| PC |
Sian Caiach |
3,865 |
9.33% |
| L |
Martin Caton |
17,676 |
42.65% |
| SL |
Darran Hickery |
4,507 |
10.88% |
| G |
Tina Shrewsbury |
607 |
1.46% |
| LD |
Sheila Waye |
4,507 |
10.88% |
|
Candidates representing 6 parties stood for election to this seat.
|
|
 |
Martin Caton
Labour
|
| Con |
 |
10,306 |
23.78% |
| Lab |
 |
23,313 |
53.80% |
| LD |
 |
5,624 |
12.98% |
| PC |
 |
2,226 |
5.14% |
| Ref |
 |
1,745 |
4.03% |
| Oth |
 |
122 |
0.28% |
| Maj |
 |
13,007 |
30.01% |
| Turn |
 |
43,336 |
75.12% |
|
|
 |
|
Labour
|
| Con |
 |
16,437 |
35.10% |
| Lab |
 |
23,485 |
50.10% |
| LD |
 |
4,655 |
9.90% |
| PC |
 |
1,639 |
3.50% |
| Oth |
 |
636 |
1.40% |
| Maj |
 |
7,048 |
15.00% |
| Turn |
 |
46,852 |
80.24% |
|
|
 |
|

|

