|
Grantham & Stamford
Conservative hold

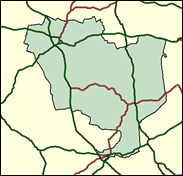
Set in south west Lincolnshire, this seat looks, feels and plays the part of a solid Conservative banker. Stamford is a delightful example of a relatively unspoilt medieval English town, just off the A1, in the shadow of the Burghley House of the Cecil family, with its town centre of fine churches, houses and shops frequently hijacked by film crews - for example as the setting of Middlemarch. Grantham is the home town of the Iron Lady herself; there is a blue plaque above her father's substantial corner shop, and blue remains the colour of the seat as a whole, despite the usual huge swing to Labour in 1997 and the presence of strongly Labour wards in parts of Grantham such as Harrowby (to the east) and Earlesfield (to the west).

Quentin Davies, a Defence spokesman, was elected here in 1987, but had to wait until the Conservatives were in opposition to reach the front bench, in 1998. A pin-striped merchant banker (and before that a diplomat) with a loud-voiced arrogant manner, he is seen by one former Commons clerk as "a complete pain in the arse". He is a Thatcherite Europhile who disliked his heroine's Bruges speech, and upped his profile by savaging David Willetts' "dissembling weasel words" over the Hamilton affair. Born 1944, educated at Leighton Park School, Reading, Gonville & Caius College, Cambridge and Harvard, his Europhilia made him a Clarke-backer in 1997, but it is as much his age and unclubbability that probably preclude his ever reaching government office. Labour's John Robinson, born 1958 and educated at Sedgefield Community College and at Teesside College, is a nurse-turned-administrator as Director of Business Development with Hospital Health Care
 |
| Wealthy Achievers, Suburban Areas |
15.99% |
14.99% |
106.64 |
|
| Affluent Greys, Rural Communities |
3.44% |
2.13% |
161.94 |
|
| Prosperous Pensioners, Retirement Areas |
3.83% |
2.49% |
154.02 |
|
| Affluent Executives, Family Areas |
10.04% |
4.43% |
226.91 |
|
| Well-Off Workers, Family Areas |
12.15% |
7.27% |
167.06 |
|
| Affluent Urbanites, Town & City Areas |
0.02% |
2.56% |
0.90 |
|
| Prosperous Professionals, Metropolitan Areas |
0.00% |
2.04% |
0.00 |
|
| Better-Off Executives, Inner City Areas |
1.03% |
3.94% |
26.16 |
|
| Comfortable Middle Agers, Mature Home Owning Areas |
20.11% |
13.04% |
154.19 |
|
| Skilled Workers, Home Owning Areas |
9.78% |
12.70% |
77.02 |
|
| New Home Owners, Mature Communities |
11.55% |
8.14% |
141.85 |
|
| White Collar Workers, Better-Off Multi Ethnic Areas |
2.35% |
4.02% |
58.42 |
|
| Older People, Less Prosperous Areas |
1.41% |
3.19% |
44.41 |
|
| Council Estate Residents, Better-Off Homes |
4.94% |
11.31% |
43.70 |
|
| Council Estate Residents, High Unemployment |
0.32% |
3.06% |
10.41 |
|
| Council Estate Residents, Greatest Hardship |
3.01% |
2.52% |
119.48 |
|
| People in Multi-Ethnic, Low-Income Areas |
0.00% |
2.10% |
0.00 |
|
| Unclassified |
0.02% |
0.06% |
27.34 |
|
|
 |
 |
 |
| £0-5K |
8.54% |
9.41% |
90.75 |
|
| £5-10K |
16.88% |
16.63% |
101.49 |
|
| £10-15K |
17.55% |
16.58% |
105.85 |
|
| £15-20K |
14.47% |
13.58% |
106.52 |
|
| £20-25K |
10.94% |
10.39% |
105.31 |
|
| £25-30K |
8.02% |
7.77% |
103.21 |
|
| £30-35K |
5.83% |
5.79% |
100.72 |
|
| £35-40K |
4.25% |
4.33% |
98.12 |
|
| £40-45K |
3.12% |
3.27% |
95.53 |
|
| £45-50K |
2.31% |
2.48% |
93.02 |
|
| £50-55K |
1.73% |
1.90% |
90.63 |
|
| £55-60K |
1.30% |
1.47% |
88.38 |
|
| £60-65K |
0.99% |
1.15% |
86.26 |
|
| £65-70K |
0.76% |
0.91% |
84.28 |
|
| £70-75K |
0.59% |
0.72% |
82.43 |
|
| £75-80K |
0.46% |
0.57% |
80.71 |
|
| £80-85K |
0.37% |
0.46% |
79.10 |
|
| £85-90K |
0.29% |
0.37% |
77.60 |
|
| £90-95K |
0.23% |
0.31% |
76.20 |
|
| £95-100K |
0.19% |
0.25% |
74.90 |
|
| £100K + |
0.92% |
1.34% |
68.39 |
|
|
|

|


|
1992-1997
|
1997-2001
|
|
|
|
| Con |
-15.10% |
| Lab |
11.62% |
| LD |
-3.52% |
|
| Con |
3.28% |
| Lab |
-1.40% |
| LD |
1.92% |
|
|
 |
Quentin Davies
Conservative hold
|
| Con |
 |
21,329 |
46.08% |
| Lab |
 |
16,811 |
36.32% |
| LD |
 |
6,665 |
14.40% |
| Oth |
 |
1,484 |
3.21% |
| Maj |
 |
4,518 |
9.76% |
| Turn |
 |
46,289 |
62.20% |
|
|
 |
Quentin Davies
Conservative hold
|
| LD |
Jane Carr |
6,665 |
14.40% |
| C |
Quentin Davies |
21,329 |
46.08% |
| L |
John Robinson |
16,811 |
36.32% |
| UK |
Marilyn Swain |
1,484 |
3.21% |
|
Candidates representing 4 parties stood for election to this seat.
|
|
 |
Quentin Davies
Conservative
|
| Con |
 |
22,672 |
42.80% |
| Lab |
 |
19,980 |
37.72% |
| LD |
 |
6,612 |
12.48% |
| Ref |
 |
2,721 |
5.14% |
| Oth |
 |
985 |
1.86% |
| Maj |
 |
2,692 |
5.08% |
| Turn |
 |
52,970 |
73.25% |
|
|
 |
|
Conservative
|
| Con |
 |
31,263 |
57.90% |
| Lab |
 |
14,105 |
26.10% |
| LD |
 |
8,663 |
16.00% |
| Oth |
|
0 |
0.00% |
| Maj |
 |
17,158 |
31.80% |
| Turn |
 |
54,031 |
80.13% |
|
|
 |
|

|

