|
Barnsley West & Penistone
Labour hold

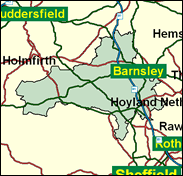
The least monolithically Labour of the three in the South Yorkshire Borough of Barnsley, though this is not saying much. There are at least some Conservative votes, and currently a few councillors, in the town of Penistone over towards the Pennines, which along with some stonewalled villages belongs to a different culture from the heavy industrial and mining traditions of Barnsley itself. The Liberal Democrats advanced in 1997, although still a distant third place, and, unusually, Labour barely increased their share of the vote in that year. Nevertheless, this is an utterly solid Labour hold.

Mick Clapham, an ex-miner , born 1943 and educated at Barnsley Technical College, Leeds Poly and Bradford University was elected in 1992. As a Campaign Grouper he is actively rebellious against the government, resigning as Alan Millburn's PPS over lone parent child benefit cuts, and voting against the Whips on military action against Iraq, the Prime Minister's right to nominate life peers, curbing jury trials, cutting disability benefit, restoring the link between pensions and average earnings, and air traffic control privatisation. An ex-Scargill ally who has since attacked his former patron's ‘Stalinist' excesses, his strikingly arched eyebrows give him a quizzical look, and for some he recalls a character out of ‘Sons and Lovers'.
 |
| Wealthy Achievers, Suburban Areas |
12.16% |
14.99% |
81.12 |
|
| Affluent Greys, Rural Communities |
0.16% |
2.13% |
7.63 |
|
| Prosperous Pensioners, Retirement Areas |
1.83% |
2.49% |
73.66 |
|
| Affluent Executives, Family Areas |
3.04% |
4.43% |
68.63 |
|
| Well-Off Workers, Family Areas |
7.17% |
7.27% |
98.64 |
|
| Affluent Urbanites, Town & City Areas |
0.06% |
2.56% |
2.16 |
|
| Prosperous Professionals, Metropolitan Areas |
0.00% |
2.04% |
0.00 |
|
| Better-Off Executives, Inner City Areas |
0.00% |
3.94% |
0.00 |
|
| Comfortable Middle Agers, Mature Home Owning Areas |
10.20% |
13.04% |
78.23 |
|
| Skilled Workers, Home Owning Areas |
22.94% |
12.70% |
180.56 |
|
| New Home Owners, Mature Communities |
23.53% |
8.14% |
288.98 |
|
| White Collar Workers, Better-Off Multi Ethnic Areas |
0.00% |
4.02% |
0.00 |
|
| Older People, Less Prosperous Areas |
4.65% |
3.19% |
145.96 |
|
| Council Estate Residents, Better-Off Homes |
13.64% |
11.31% |
120.56 |
|
| Council Estate Residents, High Unemployment |
0.14% |
3.06% |
4.49 |
|
| Council Estate Residents, Greatest Hardship |
0.48% |
2.52% |
19.24 |
|
| People in Multi-Ethnic, Low-Income Areas |
0.00% |
2.10% |
0.00 |
|
| Unclassified |
0.00% |
0.06% |
0.00 |
|
|
 |
 |
 |
| £0-5K |
12.14% |
9.41% |
129.01 |
|
| £5-10K |
19.31% |
16.63% |
116.08 |
|
| £10-15K |
17.88% |
16.58% |
107.85 |
|
| £15-20K |
13.78% |
13.58% |
101.42 |
|
| £20-25K |
9.98% |
10.39% |
96.05 |
|
| £25-30K |
7.11% |
7.77% |
91.45 |
|
| £30-35K |
5.06% |
5.79% |
87.44 |
|
| £35-40K |
3.64% |
4.33% |
83.91 |
|
| £40-45K |
2.64% |
3.27% |
80.78 |
|
| £45-50K |
1.94% |
2.48% |
77.99 |
|
| £50-55K |
1.44% |
1.90% |
75.48 |
|
| £55-60K |
1.08% |
1.47% |
73.22 |
|
| £60-65K |
0.82% |
1.15% |
71.18 |
|
| £65-70K |
0.63% |
0.91% |
69.32 |
|
| £70-75K |
0.49% |
0.72% |
67.62 |
|
| £75-80K |
0.38% |
0.57% |
66.07 |
|
| £80-85K |
0.30% |
0.46% |
64.65 |
|
| £85-90K |
0.24% |
0.37% |
63.34 |
|
| £90-95K |
0.19% |
0.31% |
62.14 |
|
| £95-100K |
0.15% |
0.25% |
61.02 |
|
| £100K + |
0.75% |
1.34% |
55.70 |
|
|
|

|


|
1992-1997
|
1997-2001
|
|
|
|
| Con |
-9.64% |
| Lab |
0.97% |
| LD |
6.34% |
|
| Con |
4.47% |
| Lab |
-0.70% |
| LD |
0.56% |
|
|
 |
Michael Clapham
Labour hold
|
| Con |
 |
7,892 |
22.83% |
| Lab |
 |
20,244 |
58.57% |
| LD |
 |
6,428 |
18.60% |
| Oth |
|
0 |
0.00% |
| Maj |
 |
12,352 |
35.74% |
| Turn |
 |
34,564 |
52.94% |
|
|
 |
Michael Clapham
Labour hold
|
| L |
Michael Clapham |
20,244 |
58.57% |
| LD |
Miles Crompton |
6,428 |
18.60% |
| C |
William Rowe |
7,892 |
22.83% |
|
Candidates representing 3 parties stood for election to this seat.
|
|
 |
Michael Clapham
Labour
|
| Con |
 |
7,750 |
18.36% |
| Lab |
 |
25,017 |
59.27% |
| LD |
 |
7,613 |
18.04% |
| Ref |
 |
1,828 |
4.33% |
| Oth |
|
0 |
0.00% |
| Maj |
 |
17,267 |
40.91% |
| Turn |
 |
42,208 |
65.04% |
|
|
 |
|
Labour
|
| Con |
 |
13,461 |
28.00% |
| Lab |
 |
27,965 |
58.30% |
| LD |
 |
5,610 |
11.70% |
| Oth |
 |
970 |
2.00% |
| Maj |
 |
14,504 |
30.20% |
| Turn |
 |
48,006 |
75.32% |
|
|
 |
|

|

