|
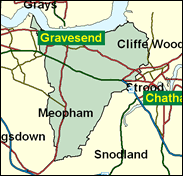
Gravesham
Labour hold

The Conservatives' chances of regaining this seat, one of their eight losses in the county of Kent, seem slim, as the Borough of Gravesham returned almost twice as many Labour councillors (29 to 15) in elections on the same boundaries in May 1999, and were nearly nine per cent ahead in the aggregate of the popular vote on a turnout of 32 per cent in a midterm year. Chris Pond, the former director of the Low Pay Unit, looks likely to draw his parliamentary salary for another term.

Chris Pond, PPS to Paymaster General Dawn Primarolo, ought to have expected something better as a high profile social policy expert who ran the Low Pay Unit before being elected here in 1997, but may not have been well served by a soft-spoken, unpartisan manner. A milkman's son, born 1952, educated at secondary schools in Palmers Green and Southgate, and Sussex University, he held various university research posts before spending 17 years at the Low Pay Unit. Now divorced from ex-MEP Carole Tongue, he has been dubbed a "stomach-churning loyalist" by the Independent, and a government "stooge" by Tory MP Julie Kirkbride.
 |
| Wealthy Achievers, Suburban Areas |
17.11% |
14.99% |
114.09 |
|
| Affluent Greys, Rural Communities |
0.07% |
2.13% |
3.15 |
|
| Prosperous Pensioners, Retirement Areas |
0.72% |
2.49% |
28.91 |
|
| Affluent Executives, Family Areas |
1.85% |
4.43% |
41.89 |
|
| Well-Off Workers, Family Areas |
10.76% |
7.27% |
147.87 |
|
| Affluent Urbanites, Town & City Areas |
0.62% |
2.56% |
24.13 |
|
| Prosperous Professionals, Metropolitan Areas |
0.00% |
2.04% |
0.00 |
|
| Better-Off Executives, Inner City Areas |
1.70% |
3.94% |
43.02 |
|
| Comfortable Middle Agers, Mature Home Owning Areas |
10.00% |
13.04% |
76.66 |
|
| Skilled Workers, Home Owning Areas |
19.69% |
12.70% |
154.99 |
|
| New Home Owners, Mature Communities |
9.80% |
8.14% |
120.33 |
|
| White Collar Workers, Better-Off Multi Ethnic Areas |
4.89% |
4.02% |
121.70 |
|
| Older People, Less Prosperous Areas |
5.36% |
3.19% |
168.12 |
|
| Council Estate Residents, Better-Off Homes |
11.17% |
11.31% |
98.74 |
|
| Council Estate Residents, High Unemployment |
1.56% |
3.06% |
50.89 |
|
| Council Estate Residents, Greatest Hardship |
4.41% |
2.52% |
174.95 |
|
| People in Multi-Ethnic, Low-Income Areas |
0.31% |
2.10% |
15.00 |
|
| Unclassified |
0.00% |
0.06% |
7.04 |
|
|
 |
 |
 |
| £0-5K |
8.60% |
9.41% |
91.35 |
|
| £5-10K |
15.21% |
16.63% |
91.43 |
|
| £10-15K |
15.89% |
16.58% |
95.86 |
|
| £15-20K |
13.63% |
13.58% |
100.38 |
|
| £20-25K |
10.81% |
10.39% |
104.01 |
|
| £25-30K |
8.29% |
7.77% |
106.65 |
|
| £30-35K |
6.28% |
5.79% |
108.43 |
|
| £35-40K |
4.75% |
4.33% |
109.53 |
|
| £40-45K |
3.60% |
3.27% |
110.11 |
|
| £45-50K |
2.74% |
2.48% |
110.31 |
|
| £50-55K |
2.10% |
1.90% |
110.23 |
|
| £55-60K |
1.62% |
1.47% |
109.95 |
|
| £60-65K |
1.26% |
1.15% |
109.52 |
|
| £65-70K |
0.99% |
0.91% |
109.00 |
|
| £70-75K |
0.78% |
0.72% |
108.41 |
|
| £75-80K |
0.62% |
0.57% |
107.78 |
|
| £80-85K |
0.50% |
0.46% |
107.13 |
|
| £85-90K |
0.40% |
0.37% |
106.45 |
|
| £90-95K |
0.32% |
0.31% |
105.78 |
|
| £95-100K |
0.26% |
0.25% |
105.11 |
|
| £100K + |
1.35% |
1.34% |
100.78 |
|
|
|

|


|
1992-1997
|
1997-2001
|
|
|
|
| Con |
-10.76% |
| Lab |
9.29% |
| LD |
-1.15% |
|
| Con |
-0.08% |
| Lab |
0.21% |
| LD |
1.49% |
|
|
 |
Chris Pond
Labour hold
|
| Con |
 |
16,911 |
38.75% |
| Lab |
 |
21,773 |
49.89% |
| LD |
 |
4,031 |
9.24% |
| Oth |
 |
924 |
2.12% |
| Maj |
 |
4,862 |
11.14% |
| Turn |
 |
43,639 |
62.71% |
|
|
 |
Chris Pond
Labour hold
|
| C |
Jacques Arnold |
16,911 |
38.75% |
| UK |
William Jenner |
924 |
2.12% |
| LD |
Bruce Parmenter |
4,031 |
9.24% |
| L |
Chris Pond |
21,773 |
49.89% |
|
Candidates representing 4 parties stood for election to this seat.
|
|
 |
Chris Pond
Labour gain
|
| Con |
 |
20,681 |
38.84% |
| Lab |
 |
26,460 |
49.69% |
| LD |
 |
4,128 |
7.75% |
| Ref |
 |
1,441 |
2.71% |
| Oth |
 |
543 |
1.02% |
| Maj |
 |
5,779 |
10.85% |
| Turn |
 |
53,253 |
76.92% |
|
|
 |
|
Conservative
|
| Con |
 |
29,031 |
49.60% |
| Lab |
 |
23,663 |
40.40% |
| LD |
 |
5,207 |
8.90% |
| Oth |
 |
634 |
1.10% |
| Maj |
 |
5,368 |
9.20% |
| Turn |
 |
58,535 |
83.01% |
|
|
 |
|

|

