|
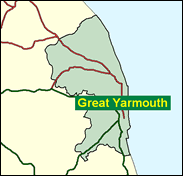
Great Yarmouth
Labour hold

The Tories have only lost the east coast Norfolk division of Great Yarmouth in years when Labour has formed a government with an overall majority, and they harbour hope of a regain next time, certainly if Mr Blair's grip on Downing Street should slacken from its present vice-like and determined state. In both May 1999 (by four-and-a-half per cent) and 2000 (14.5 per cent) they outpolled Labour candidates for Great Yarmouth Borough Council, in the latter year winning 12 of the 16 wards, with seven gains. These are much worse results for Labour than most seats of this level of marginality, and local factors may well be influential. Unemployment is well below the national average, and has not fallen as steeply under New Labour as in other places. It remains to be seen which way this will cut as the government seeks a second term of office.

Labour's Tony Wright is an unobtrusive loyalist namesake of the much more high profile maverick MP for Cannock & Burntwood. A local man with a jowly face and heavy build, he led Yarmouth Council and ran the local Labour Party organisation. Originally an engineer, he was born in 1954 and was educated at a secondary modern school. As a foreign tripper he has taken up the cause of Greek Cyprus, and has set up an all party group on ME, which makes a change from calling for the dualling of the A47.
 |
| Wealthy Achievers, Suburban Areas |
6.63% |
14.99% |
44.22 |
|
| Affluent Greys, Rural Communities |
3.77% |
2.13% |
177.18 |
|
| Prosperous Pensioners, Retirement Areas |
6.36% |
2.49% |
255.65 |
|
| Affluent Executives, Family Areas |
2.14% |
4.43% |
48.34 |
|
| Well-Off Workers, Family Areas |
8.14% |
7.27% |
111.88 |
|
| Affluent Urbanites, Town & City Areas |
0.00% |
2.56% |
0.00 |
|
| Prosperous Professionals, Metropolitan Areas |
0.00% |
2.04% |
0.00 |
|
| Better-Off Executives, Inner City Areas |
6.32% |
3.94% |
160.21 |
|
| Comfortable Middle Agers, Mature Home Owning Areas |
19.32% |
13.04% |
148.19 |
|
| Skilled Workers, Home Owning Areas |
14.44% |
12.70% |
113.71 |
|
| New Home Owners, Mature Communities |
9.06% |
8.14% |
111.31 |
|
| White Collar Workers, Better-Off Multi Ethnic Areas |
4.37% |
4.02% |
108.64 |
|
| Older People, Less Prosperous Areas |
7.11% |
3.19% |
223.05 |
|
| Council Estate Residents, Better-Off Homes |
5.41% |
11.31% |
47.84 |
|
| Council Estate Residents, High Unemployment |
3.09% |
3.06% |
100.77 |
|
| Council Estate Residents, Greatest Hardship |
3.85% |
2.52% |
152.80 |
|
| People in Multi-Ethnic, Low-Income Areas |
0.00% |
2.10% |
0.00 |
|
| Unclassified |
0.00% |
0.06% |
0.00 |
|
|
 |
|
|
| £0-5K |
14.42% |
9.41% |
153.20 |
|
| £5-10K |
22.80% |
16.63% |
137.08 |
|
| £10-15K |
19.70% |
16.58% |
118.85 |
|
| £15-20K |
13.97% |
13.58% |
102.86 |
|
| £20-25K |
9.32% |
10.39% |
89.69 |
|
| £25-30K |
6.14% |
7.77% |
79.01 |
|
| £30-35K |
4.07% |
5.79% |
70.33 |
|
| £35-40K |
2.74% |
4.33% |
63.23 |
|
| £40-45K |
1.87% |
3.27% |
57.36 |
|
| £45-50K |
1.30% |
2.48% |
52.45 |
|
| £50-55K |
0.92% |
1.90% |
48.30 |
|
| £55-60K |
0.66% |
1.47% |
44.76 |
|
| £60-65K |
0.48% |
1.15% |
41.70 |
|
| £65-70K |
0.35% |
0.91% |
39.05 |
|
| £70-75K |
0.26% |
0.72% |
36.73 |
|
| £75-80K |
0.20% |
0.57% |
34.68 |
|
| £80-85K |
0.15% |
0.46% |
32.86 |
|
| £85-90K |
0.12% |
0.37% |
31.23 |
|
| £90-95K |
0.09% |
0.31% |
29.77 |
|
| £95-100K |
0.07% |
0.25% |
28.45 |
|
| £100K + |
0.30% |
1.34% |
22.68 |
|
|
|
|


|
1992-1997
|
1997-2001
|
|
|
|
| Con |
-12.27% |
| Lab |
15.36% |
| LD |
-2.59% |
|
| Con |
3.46% |
| Lab |
-2.96% |
| LD |
-2.61% |
|
|
|
Tony Wright
Labour hold
|
| Con |
 |
15,780 |
39.09% |
| Lab |
 |
20,344 |
50.40% |
| LD |
 |
3,392 |
8.40% |
| Oth |
 |
850 |
2.11% |
| Maj |
 |
4,564 |
11.31% |
| Turn |
|
40,366 |
58.40% |
|
|
|
Tony Wright
Labour hold
|
| LD |
Maurice Leeke |
3,392 |
8.40% |
| UK |
Bertie Poole |
850 |
2.11% |
| C |
Charles Reynolds |
15,780 |
39.09% |
| L |
Tony Wright |
20,344 |
50.40% |
|
Candidates representing 4 parties stood for election to this seat.
|
|
|
Tony Wright
Labour gain
|
| Con |
|
17,416 |
35.63% |
| Lab |
|
26,084 |
53.36% |
| LD |
|
5,381 |
11.01% |
| Ref |
|
0 |
0.00% |
| Oth |
|
0 |
0.00% |
| Maj |
|
8,668 |
17.73% |
| Turn |
|
48,881 |
71.23% |
|
|
|
|
Conservative
|
| Con |
|
25,505 |
47.90% |
| Lab |
|
20,196 |
38.00% |
| LD |
|
7,225 |
13.60% |
| Oth |
|
284 |
0.50% |
| Maj |
|
5,309 |
10.00% |
| Turn |
|
53,210 |
77.87% |
|
|
|
|
|