|
Greenock & Inverclyde
Labour hold

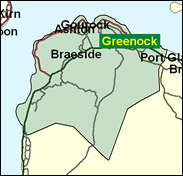
Historically one of the few Labour - Liberal marginals, in which the centrist Alliance reached 36 per cent of the vote in 1983 after the defection of sitting Labour MP Dickson Mabon, this seat at the mouth of the Clyde now looks safe for Labour in parliamentary terms. The Liberal Democrats still do well in local elections, and finished a very respectable second to Labour in the first contest for a Scottish parliament seat here in 1999, but their General Election vote slumped to less than 14 per cent in both 1992 and 1997 and they are not seen as serious contenders for Westminster. Industries and occupations associated with seafaring have declined here, to be replaced with a specialisation in electronics and computing - both IBM and National Semi-Conductors have major plants in the town.

David Cairns, the new Labour candidate here, is already well known for his campaign against the disqualification from sitting in Parliament of ex-Roman Catholic priests like himself, and for whom the law was changed in February this year. Born 1966 and educated at Notre Dame High School, Greenock, the Gregorian University, Rome, and the Franciscan Study Centre, Canterbury, he was a priest for three years before becoming Director of the Christian Socialist Movement in 1994. He was research assistant to Siobhain McDonagh, MP for Mitcham and Morden and sister of Labour's General Secretary Margaret McDonagh. He has been a Merton councillor since 1998 and Chief Whip since 1999. His predecessor in this seat, Dr Norman Godman, has said: "I wanted to be succeeded by a woman with good, honourable, Old Labour qualifications."
 |
| Wealthy Achievers, Suburban Areas |
5.40% |
14.99% |
36.01 |
|
| Affluent Greys, Rural Communities |
0.00% |
2.13% |
0.00 |
|
| Prosperous Pensioners, Retirement Areas |
0.69% |
2.49% |
27.77 |
|
| Affluent Executives, Family Areas |
2.65% |
4.43% |
59.92 |
|
| Well-Off Workers, Family Areas |
6.93% |
7.27% |
95.32 |
|
| Affluent Urbanites, Town & City Areas |
7.06% |
2.56% |
275.36 |
|
| Prosperous Professionals, Metropolitan Areas |
1.54% |
2.04% |
75.49 |
|
| Better-Off Executives, Inner City Areas |
1.43% |
3.94% |
36.34 |
|
| Comfortable Middle Agers, Mature Home Owning Areas |
3.22% |
13.04% |
24.71 |
|
| Skilled Workers, Home Owning Areas |
4.54% |
12.70% |
35.75 |
|
| New Home Owners, Mature Communities |
5.76% |
8.14% |
70.76 |
|
| White Collar Workers, Better-Off Multi Ethnic Areas |
0.66% |
4.02% |
16.49 |
|
| Older People, Less Prosperous Areas |
7.64% |
3.19% |
239.87 |
|
| Council Estate Residents, Better-Off Homes |
19.29% |
11.31% |
170.51 |
|
| Council Estate Residents, High Unemployment |
18.48% |
3.06% |
603.59 |
|
| Council Estate Residents, Greatest Hardship |
14.57% |
2.52% |
578.68 |
|
| People in Multi-Ethnic, Low-Income Areas |
0.00% |
2.10% |
0.00 |
|
| Unclassified |
0.12% |
0.06% |
188.37 |
|
|
 |
 |
 |
| £0-5K |
12.25% |
9.41% |
130.13 |
|
| £5-10K |
19.81% |
16.63% |
119.08 |
|
| £10-15K |
17.95% |
16.58% |
108.27 |
|
| £15-20K |
13.60% |
13.58% |
100.11 |
|
| £20-25K |
9.77% |
10.39% |
93.99 |
|
| £25-30K |
6.94% |
7.77% |
89.30 |
|
| £30-35K |
4.96% |
5.79% |
85.57 |
|
| £35-40K |
3.58% |
4.33% |
82.51 |
|
| £40-45K |
2.61% |
3.27% |
79.90 |
|
| £45-50K |
1.93% |
2.48% |
77.60 |
|
| £50-55K |
1.44% |
1.90% |
75.51 |
|
| £55-60K |
1.08% |
1.47% |
73.58 |
|
| £60-65K |
0.83% |
1.15% |
71.75 |
|
| £65-70K |
0.63% |
0.91% |
70.01 |
|
| £70-75K |
0.49% |
0.72% |
68.34 |
|
| £75-80K |
0.38% |
0.57% |
66.72 |
|
| £80-85K |
0.30% |
0.46% |
65.15 |
|
| £85-90K |
0.24% |
0.37% |
63.62 |
|
| £90-95K |
0.19% |
0.31% |
62.13 |
|
| £95-100K |
0.15% |
0.25% |
60.69 |
|
| £100K + |
0.70% |
1.34% |
52.03 |
|
|
|

|


|
1992-1997
|
1997-2001
|
|
|
|
| Con |
-9.64% |
| Lab |
8.36% |
| LD |
-0.09% |
| SNP |
1.27% |
|
| Con |
-0.91% |
| Lab |
-3.63% |
| LD |
3.92% |
| SNP |
-3.62% |
|
|
 |
David Cairns
Labour hold
|
| Con |
 |
3,000 |
10.56% |
| Lab |
 |
14,929 |
52.53% |
| LD |
 |
5,039 |
17.73% |
| SNP |
 |
4,248 |
14.95% |
| Oth |
 |
1,203 |
4.23% |
| Maj |
 |
9,890 |
34.80% |
| Turn |
 |
28,419 |
59.35% |
|
|
 |
David Cairns
Labour hold
|
| LD |
Chic Brodie |
5,039 |
17.73% |
| L |
David Cairns |
14,929 |
52.53% |
| C |
Alistair Haw |
3,000 |
10.56% |
| SSP |
Davey Landels |
1,203 |
4.23% |
| SNP |
Andrew Murie |
4,248 |
14.95% |
|
Candidates representing 5 parties stood for election to this seat.
|
|
 |
Norman Godman
Labour
|
| Con |
 |
3,976 |
11.46% |
| Lab |
 |
19,480 |
56.16% |
| LD |
 |
4,791 |
13.81% |
| SNP |
 |
6,440 |
18.57% |
| Ref |
|
0 |
0.00% |
| Oth |
|
0 |
0.00% |
| Maj |
 |
13,040 |
37.59% |
| Turn |
 |
34,687 |
71.05% |
|
|
 |
|
Labour
|
| Con |
 |
8,081 |
21.10% |
| Lab |
 |
18,319 |
47.80% |
| LD |
 |
5,324 |
13.90% |
| SNP |
 |
6,621 |
17.30% |
| Oth |
|
0 |
0.00% |
| Maj |
 |
10,238 |
26.70% |
| Turn |
 |
38,345 |
74.54% |
|
|
 |
|

|

