|
Greenwich & Woolwich
Labour hold

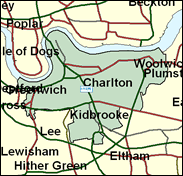
This predominantly working class south east London riverside seat has a curious, in fact unique, electoral history. Both halves, Greenwich and Woolwich, before they were merged in 1997, had been represented by SDP candidates, standing first under the banner of the Alliance and re-elected in 1987, later opposing full merger with the Liberals and nearly winning re-election again in 1992 as independent Social Democrats. They were John Cartwright of Woolwich and Rosie Barnes, who had first come to fame as the winner of the Greenwich by-election in early 1987. By 1997, however, both these former MPs had long departed the scene, and Labour's Nick Raynsford, himself in an earlier incarnation the winner of a key by-election at Fulham in 1986 triumphed by 18,000 and now has a very safe seat, despite the less than wholly successful performance of the Millennium Dome, the major landmark within this constituency.

Nick Raynsford, born 1945 and public school and Cambridge (Repton and Sidney Sussex)-educated, is one of Labour's rare toffs, in his case from a family of Northamptonshire squires, traceable back to the 15th century, with his full name being 'Wyvill Richard Nicholls Raynsford'. A tall, balding, permanently smiling, uncharismatic technocrat, he was elected for Greenwich in 1992, having briefly sat for Fulham 1986-87. A perennial spokesman on housing and London, as a Minister he piloted through the legislation recreating both a London Assembly and Ken Livingstone.
 |
| Wealthy Achievers, Suburban Areas |
0.45% |
14.99% |
3.01 |
|
| Affluent Greys, Rural Communities |
0.00% |
2.13% |
0.00 |
|
| Prosperous Pensioners, Retirement Areas |
2.37% |
2.49% |
95.34 |
|
| Affluent Executives, Family Areas |
2.18% |
4.43% |
49.18 |
|
| Well-Off Workers, Family Areas |
0.09% |
7.27% |
1.22 |
|
| Affluent Urbanites, Town & City Areas |
4.24% |
2.56% |
165.25 |
|
| Prosperous Professionals, Metropolitan Areas |
14.75% |
2.04% |
722.44 |
|
| Better-Off Executives, Inner City Areas |
6.69% |
3.94% |
169.56 |
|
| Comfortable Middle Agers, Mature Home Owning Areas |
5.31% |
13.04% |
40.71 |
|
| Skilled Workers, Home Owning Areas |
1.05% |
12.70% |
8.27 |
|
| New Home Owners, Mature Communities |
2.66% |
8.14% |
32.67 |
|
| White Collar Workers, Better-Off Multi Ethnic Areas |
13.11% |
4.02% |
325.91 |
|
| Older People, Less Prosperous Areas |
1.52% |
3.19% |
47.81 |
|
| Council Estate Residents, Better-Off Homes |
10.32% |
11.31% |
91.21 |
|
| Council Estate Residents, High Unemployment |
13.42% |
3.06% |
438.11 |
|
| Council Estate Residents, Greatest Hardship |
7.72% |
2.52% |
306.54 |
|
| People in Multi-Ethnic, Low-Income Areas |
14.00% |
2.10% |
666.52 |
|
| Unclassified |
0.15% |
0.06% |
233.56 |
|
|
 |
 |
 |
| £0-5K |
10.25% |
9.41% |
108.88 |
|
| £5-10K |
15.55% |
16.63% |
93.48 |
|
| £10-15K |
15.12% |
16.58% |
91.21 |
|
| £15-20K |
12.55% |
13.58% |
92.39 |
|
| £20-25K |
9.86% |
10.39% |
94.91 |
|
| £25-30K |
7.62% |
7.77% |
97.97 |
|
| £30-35K |
5.86% |
5.79% |
101.25 |
|
| £35-40K |
4.53% |
4.33% |
104.58 |
|
| £40-45K |
3.52% |
3.27% |
107.88 |
|
| £45-50K |
2.76% |
2.48% |
111.11 |
|
| £50-55K |
2.18% |
1.90% |
114.26 |
|
| £55-60K |
1.73% |
1.47% |
117.30 |
|
| £60-65K |
1.38% |
1.15% |
120.23 |
|
| £65-70K |
1.12% |
0.91% |
123.06 |
|
| £70-75K |
0.90% |
0.72% |
125.79 |
|
| £75-80K |
0.74% |
0.57% |
128.42 |
|
| £80-85K |
0.61% |
0.46% |
130.96 |
|
| £85-90K |
0.50% |
0.37% |
133.41 |
|
| £90-95K |
0.41% |
0.31% |
135.77 |
|
| £95-100K |
0.35% |
0.25% |
138.05 |
|
| £100K + |
2.04% |
1.34% |
151.55 |
|
|
|

|


|
1992-1997
|
1997-2001
|
|
|
|
| Con |
0.37% |
| Lab |
18.84% |
| LD |
-22.60% |
|
| Con |
0.67% |
| Lab |
-2.92% |
| LD |
3.12% |
|
|
 |
Nick Raynsford
Labour hold
|
| Con |
 |
6,258 |
19.23% |
| Lab |
 |
19,691 |
60.52% |
| LD |
 |
5,082 |
15.62% |
| Oth |
 |
1,505 |
4.63% |
| Maj |
 |
13,433 |
41.29% |
| Turn |
 |
32,536 |
52.00% |
|
|
 |
Nick Raynsford
Labour hold
|
| C |
Richard Forsdyke |
6,258 |
19.23% |
| UK |
Stan Gain |
672 |
2.07% |
| SA |
Kirstie Paton |
481 |
1.48% |
| LD |
Russell Pyne |
5,082 |
15.62% |
| L |
Nick Raynsford |
19,691 |
60.52% |
| SL |
Margaret Sharkey |
352 |
1.08% |
|
Candidates representing 6 parties stood for election to this seat.
|
|
 |
Nick Raynsford
Labour
|
| Con |
 |
7,502 |
18.57% |
| Lab |
 |
25,630 |
63.44% |
| LD |
 |
5,049 |
12.50% |
| Ref |
 |
1,670 |
4.13% |
| Oth |
 |
552 |
1.37% |
| Maj |
 |
18,128 |
44.87% |
| Turn |
 |
40,403 |
65.85% |
|
|
 |
|
Labour
|
| Con |
 |
8,565 |
18.20% |
| Lab |
 |
20,951 |
44.60% |
| LD |
 |
16,478 |
35.10% |
| Oth |
 |
990 |
2.10% |
| Maj |
 |
4,473 |
9.50% |
| Turn |
 |
46,984 |
71.13% |
|
|
 |
|

|

