|
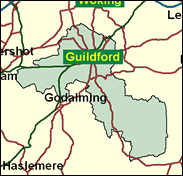
Guildford
Liberal Democrat gain

One of those seats where a car drive during a general election campaign would seem to indicate a certain Liberal Democrat victory, observing the number of posters displayed, the Surrey cathedral town of Guildford and the countryside around must harbour many thousands of Conservatives reluctant to wear their hearts on their sleeves, for it has always ended up safely in their column. In the 1997 General Election the Liberal Democrats did bring in a respectable total of 19,000 votes, but one imagines that they are likely to do still better next time - the Labour vote in the north and west of Guildford itself is well entrenched and resistant to tactical voting, and Nick St Aubyn is a strong favourite for a second term.

Nick St Aubyn (born 1955, educated at Eton and Trinity, Oxford) won Guildford in 1997 after vainly trying to take Truro off the Lib Dems in his family's native Cornwall at three previous elections. Currently a furniture manufacturer, he is an ex-merchant banker, one of 15 Etonians elected to the Tory benches in 1997, where he has developed a reputation as an advocate of extending the private sector in education and attacking Labour's populist assault on Oxford's admission system. He is also a Barbour-jacketed partisan of the Countryside Alliance.
 |
| Wealthy Achievers, Suburban Areas |
36.82% |
14.99% |
245.55 |
|
| Affluent Greys, Rural Communities |
0.00% |
2.13% |
0.00 |
|
| Prosperous Pensioners, Retirement Areas |
6.90% |
2.49% |
277.49 |
|
| Affluent Executives, Family Areas |
4.93% |
4.43% |
111.37 |
|
| Well-Off Workers, Family Areas |
6.11% |
7.27% |
83.95 |
|
| Affluent Urbanites, Town & City Areas |
4.65% |
2.56% |
181.22 |
|
| Prosperous Professionals, Metropolitan Areas |
6.54% |
2.04% |
320.20 |
|
| Better-Off Executives, Inner City Areas |
1.90% |
3.94% |
48.17 |
|
| Comfortable Middle Agers, Mature Home Owning Areas |
15.41% |
13.04% |
118.15 |
|
| Skilled Workers, Home Owning Areas |
1.61% |
12.70% |
12.67 |
|
| New Home Owners, Mature Communities |
7.70% |
8.14% |
94.59 |
|
| White Collar Workers, Better-Off Multi Ethnic Areas |
0.58% |
4.02% |
14.32 |
|
| Older People, Less Prosperous Areas |
1.67% |
3.19% |
52.54 |
|
| Council Estate Residents, Better-Off Homes |
4.49% |
11.31% |
39.69 |
|
| Council Estate Residents, High Unemployment |
0.06% |
3.06% |
1.88 |
|
| Council Estate Residents, Greatest Hardship |
0.00% |
2.52% |
0.00 |
|
| People in Multi-Ethnic, Low-Income Areas |
0.00% |
2.10% |
0.00 |
|
| Unclassified |
0.65% |
0.06% |
1,048.52 |
|
|
 |
 |
 |
| £0-5K |
5.07% |
9.41% |
53.81 |
|
| £5-10K |
9.76% |
16.63% |
58.70 |
|
| £10-15K |
11.47% |
16.58% |
69.20 |
|
| £15-20K |
11.08% |
13.58% |
81.60 |
|
| £20-25K |
9.83% |
10.39% |
94.57 |
|
| £25-30K |
8.35% |
7.77% |
107.46 |
|
| £30-35K |
6.95% |
5.79% |
119.93 |
|
| £35-40K |
5.71% |
4.33% |
131.82 |
|
| £40-45K |
4.67% |
3.27% |
143.05 |
|
| £45-50K |
3.81% |
2.48% |
153.60 |
|
| £50-55K |
3.11% |
1.90% |
163.49 |
|
| £55-60K |
2.55% |
1.47% |
172.74 |
|
| £60-65K |
2.09% |
1.15% |
181.39 |
|
| £65-70K |
1.72% |
0.91% |
189.48 |
|
| £70-75K |
1.42% |
0.72% |
197.06 |
|
| £75-80K |
1.17% |
0.57% |
204.17 |
|
| £80-85K |
0.98% |
0.46% |
210.84 |
|
| £85-90K |
0.81% |
0.37% |
217.11 |
|
| £90-95K |
0.68% |
0.31% |
223.01 |
|
| £95-100K |
0.57% |
0.25% |
228.57 |
|
| £100K + |
3.46% |
1.34% |
257.28 |
|
|
|

|


|
1992-1997
|
1997-2001
|
|
|
|
| Con |
-12.86% |
| Lab |
6.06% |
| LD |
1.23% |
|
| Con |
-1.11% |
| Lab |
-3.75% |
| LD |
8.42% |
|
|
 |
Sue Doughty
Liberal Democrat gain
|
| Con |
 |
19,820 |
41.43% |
| Lab |
 |
6,558 |
13.71% |
| LD |
 |
20,358 |
42.55% |
| Oth |
 |
1,106 |
2.31% |
| Maj |
 |
538 |
1.12% |
| Turn |
 |
47,842 |
62.91% |
|
|
 |
Sue Doughty
Liberal Democrat gain
|
| LD |
Sue Doughty |
20,358 |
42.55% |
| Pacifist |
John Morris |
370 |
0.77% |
| UK |
Sonya Porter |
736 |
1.54% |
| C |
Nick St Aubyn |
19,820 |
41.43% |
| L |
Joyce Still |
6,558 |
13.71% |
|
Candidates representing 5 parties stood for election to this seat.
|
|
 |
Nick St Aubyn
Conservative
|
| Con |
 |
24,230 |
42.54% |
| Lab |
 |
9,945 |
17.46% |
| LD |
 |
19,439 |
34.13% |
| Ref |
 |
2,650 |
4.65% |
| Oth |
 |
694 |
1.22% |
| Maj |
 |
4,791 |
8.41% |
| Turn |
 |
56,958 |
75.40% |
|
|
 |
|
Conservative
|
| Con |
 |
32,820 |
55.40% |
| Lab |
 |
6,732 |
11.40% |
| LD |
 |
19,478 |
32.90% |
| Oth |
 |
229 |
0.40% |
| Maj |
 |
13,342 |
22.50% |
| Turn |
 |
59,259 |
77.64% |
|
|
 |
|

|

