|
Hackney South & Shoreditch
Labour hold

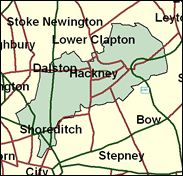
Labour lost control of the Hackney Borough Council in the 1998 local elections, and the Liberal Democrats, classically attacking a regime embattled on many fronts, returned as many councillors (14) as Labour. This does not necessarily mean that Brian Sedgemore, an independent Old Left Labour fellow, will be in trouble himself. He was opposed by an unofficial New Labour candidate in 1997, but that label only attracted 2,436 voters, and he still had a majority of nearly 15,000. Plagued with troubles as many may be here in Hoxton and Haggerston and Homerton, in Hackney Downs and London Fields, they do not seem likely to turn en masse to another for solace in a general election.

Burly, cro-magnon featured Brian Sedgemore, born 1937, educated at Heles School Exeter and Corpus Christi, Oxford, is one of Labour's iconoclastic lone operators who never advanced further than being PPS in the 1970s to Tony Benn. A quirkish left-winger who was alone in backing Maastricht, a seasoned parliamentary bruiser who likes to ridicule his Commons colleagues, and a sniffer-out of City fraud, he has rebelled against the Blair government on pensions, jury trials and disability benefit. With past employment as barrister, civil servant and TV researcher, he has ridiculed Blair's Babes as "Stepford Wives", and Ken Livingstone as "arrogant and patronising", disputing his "divine right to rule London".
 |
| Wealthy Achievers, Suburban Areas |
0.13% |
14.99% |
0.84 |
|
| Affluent Greys, Rural Communities |
0.00% |
2.13% |
0.00 |
|
| Prosperous Pensioners, Retirement Areas |
0.01% |
2.49% |
0.56 |
|
| Affluent Executives, Family Areas |
0.00% |
4.43% |
0.00 |
|
| Well-Off Workers, Family Areas |
0.00% |
7.27% |
0.00 |
|
| Affluent Urbanites, Town & City Areas |
1.14% |
2.56% |
44.41 |
|
| Prosperous Professionals, Metropolitan Areas |
7.57% |
2.04% |
371.12 |
|
| Better-Off Executives, Inner City Areas |
14.43% |
3.94% |
365.82 |
|
| Comfortable Middle Agers, Mature Home Owning Areas |
0.23% |
13.04% |
1.74 |
|
| Skilled Workers, Home Owning Areas |
0.00% |
12.70% |
0.00 |
|
| New Home Owners, Mature Communities |
0.00% |
8.14% |
0.00 |
|
| White Collar Workers, Better-Off Multi Ethnic Areas |
12.16% |
4.02% |
302.35 |
|
| Older People, Less Prosperous Areas |
0.00% |
3.19% |
0.00 |
|
| Council Estate Residents, Better-Off Homes |
0.54% |
11.31% |
4.78 |
|
| Council Estate Residents, High Unemployment |
22.68% |
3.06% |
740.78 |
|
| Council Estate Residents, Greatest Hardship |
0.50% |
2.52% |
19.89 |
|
| People in Multi-Ethnic, Low-Income Areas |
40.60% |
2.10% |
1,933.26 |
|
| Unclassified |
0.01% |
0.06% |
14.43 |
|
|
 |
 |
 |
| £0-5K |
10.71% |
9.41% |
113.77 |
|
| £5-10K |
15.25% |
16.63% |
91.69 |
|
| £10-15K |
14.76% |
16.58% |
89.05 |
|
| £15-20K |
12.35% |
13.58% |
90.92 |
|
| £20-25K |
9.80% |
10.39% |
94.28 |
|
| £25-30K |
7.63% |
7.77% |
98.09 |
|
| £30-35K |
5.91% |
5.79% |
101.95 |
|
| £35-40K |
4.58% |
4.33% |
105.71 |
|
| £40-45K |
3.57% |
3.27% |
109.30 |
|
| £45-50K |
2.80% |
2.48% |
112.71 |
|
| £50-55K |
2.21% |
1.90% |
115.94 |
|
| £55-60K |
1.75% |
1.47% |
119.00 |
|
| £60-65K |
1.40% |
1.15% |
121.91 |
|
| £65-70K |
1.13% |
0.91% |
124.69 |
|
| £70-75K |
0.92% |
0.72% |
127.36 |
|
| £75-80K |
0.75% |
0.57% |
129.93 |
|
| £80-85K |
0.61% |
0.46% |
132.40 |
|
| £85-90K |
0.50% |
0.37% |
134.80 |
|
| £90-95K |
0.42% |
0.31% |
137.13 |
|
| £95-100K |
0.35% |
0.25% |
139.40 |
|
| £100K + |
2.08% |
1.34% |
154.52 |
|
|
|

|


|
1992-1997
|
1997-2001
|
|
|
|
| Con |
-15.68% |
| Lab |
6.01% |
| LD |
0.02% |
|
| Con |
0.86% |
| Lab |
6.65% |
| LD |
-0.02% |
|
|
 |
Brian Sedgemore
Labour hold
|
| Con |
 |
4,180 |
14.18% |
| Lab |
 |
19,471 |
66.06% |
| LD |
 |
4,422 |
15.00% |
| Oth |
 |
1,401 |
4.75% |
| Maj |
 |
15,049 |
51.06% |
| Turn |
 |
29,474 |
46.06% |
|
|
 |
Brian Sedgemore
Labour hold
|
| SA |
Cecilia Prosper |
1,401 |
4.75% |
| L |
Brian Sedgemore |
19,471 |
66.06% |
| LD |
Tony Vickers |
4,422 |
15.00% |
| C |
Paul White |
4,180 |
14.18% |
|
Candidates representing 4 parties stood for election to this seat.
|
|
 |
Brian Sedgemore
Labour
|
| Con |
 |
4,494 |
13.32% |
| Lab |
 |
20,048 |
59.41% |
| LD |
 |
5,068 |
15.02% |
| Ref |
 |
613 |
1.82% |
| Oth |
 |
3,523 |
10.44% |
| Maj |
 |
14,980 |
44.39% |
| Turn |
 |
33,746 |
54.67% |
|
|
 |
|
Labour
|
| Con |
 |
10,699 |
29.00% |
| Lab |
 |
19,702 |
53.40% |
| LD |
 |
5,525 |
15.00% |
| Oth |
 |
997 |
2.70% |
| Maj |
 |
9,003 |
24.40% |
| Turn |
 |
36,923 |
54.66% |
|
|
 |
|

|

