|
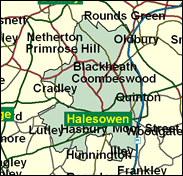
Halesowen & Rowley Regis
Labour hold

With a 21 per cent majority, that is requiring an 11 per cent swing for an overturn, it might look that Sylvia Heal, now a Deputy Speaker, should be safe at the next General Election. But the conventions concerning opposition to Speakers does not apply to their deputies, and in the high-swinging West Midlands Halesowen and Rowley Regis should still be regarded as a marginal; for example, in May 2000, a bad year for Labour in this region, the Conservative candidates in Dudley and Sandwell Borough wards within this seat clearly received more votes than their Labour counterparts. Admittedly these were Met Borough elections on a lower turnout than expected in a General Election, but the seat is worth watching.

Sylvia Heal, MP here since 1997 and before that only briefly (1990-92) for Mid Staffordshire, has reached the Commons chair as a Deputy Speaker faster than anyone in living memory or beyond, as much on a gender-balancing ticket (with the departure for the Lords of Speaker Boothroyd) as any other. As part of a Commons pair of sisters (with Ann Keen), she was born 1942, daughter of a Shotton steel worker, and educated at a local secondary modern school. She worked as a hospital records clerk, then - via Coleg Harlech - went to Swansea University and became a social worker. Denying disloyalty over lone parent benefit cuts in 1997, she said as a PPS she was unable to protest.
 |
| Wealthy Achievers, Suburban Areas |
8.09% |
14.99% |
53.93 |
|
| Affluent Greys, Rural Communities |
0.00% |
2.13% |
0.00 |
|
| Prosperous Pensioners, Retirement Areas |
0.18% |
2.49% |
7.05 |
|
| Affluent Executives, Family Areas |
2.92% |
4.43% |
65.97 |
|
| Well-Off Workers, Family Areas |
10.95% |
7.27% |
150.59 |
|
| Affluent Urbanites, Town & City Areas |
0.00% |
2.56% |
0.00 |
|
| Prosperous Professionals, Metropolitan Areas |
0.00% |
2.04% |
0.00 |
|
| Better-Off Executives, Inner City Areas |
0.00% |
3.94% |
0.00 |
|
| Comfortable Middle Agers, Mature Home Owning Areas |
15.55% |
13.04% |
119.25 |
|
| Skilled Workers, Home Owning Areas |
17.76% |
12.70% |
139.84 |
|
| New Home Owners, Mature Communities |
23.23% |
8.14% |
285.22 |
|
| White Collar Workers, Better-Off Multi Ethnic Areas |
0.00% |
4.02% |
0.00 |
|
| Older People, Less Prosperous Areas |
5.46% |
3.19% |
171.28 |
|
| Council Estate Residents, Better-Off Homes |
12.02% |
11.31% |
106.28 |
|
| Council Estate Residents, High Unemployment |
2.44% |
3.06% |
79.67 |
|
| Council Estate Residents, Greatest Hardship |
1.41% |
2.52% |
55.99 |
|
| People in Multi-Ethnic, Low-Income Areas |
0.00% |
2.10% |
0.00 |
|
| Unclassified |
0.00% |
0.06% |
0.00 |
|
|
 |
 |
 |
| £0-5K |
12.61% |
9.41% |
133.96 |
|
| £5-10K |
19.24% |
16.63% |
115.68 |
|
| £10-15K |
17.78% |
16.58% |
107.25 |
|
| £15-20K |
13.78% |
13.58% |
101.45 |
|
| £20-25K |
10.04% |
10.39% |
96.59 |
|
| £25-30K |
7.16% |
7.77% |
92.16 |
|
| £30-35K |
5.10% |
5.79% |
88.01 |
|
| £35-40K |
3.64% |
4.33% |
84.11 |
|
| £40-45K |
2.63% |
3.27% |
80.46 |
|
| £45-50K |
1.91% |
2.48% |
77.05 |
|
| £50-55K |
1.41% |
1.90% |
73.88 |
|
| £55-60K |
1.05% |
1.47% |
70.93 |
|
| £60-65K |
0.79% |
1.15% |
68.21 |
|
| £65-70K |
0.60% |
0.91% |
65.68 |
|
| £70-75K |
0.46% |
0.72% |
63.33 |
|
| £75-80K |
0.35% |
0.57% |
61.16 |
|
| £80-85K |
0.27% |
0.46% |
59.14 |
|
| £85-90K |
0.21% |
0.37% |
57.26 |
|
| £90-95K |
0.17% |
0.31% |
55.51 |
|
| £95-100K |
0.13% |
0.25% |
53.88 |
|
| £100K + |
0.62% |
1.34% |
45.79 |
|
|
|

|


|
1992-1997
|
1997-2001
|
|
|
|
| Con |
-11.83% |
| Lab |
9.57% |
| LD |
-1.35% |
|
| Con |
1.36% |
| Lab |
-1.10% |
| LD |
1.86% |
|
|
 |
Sylvia Heal
Labour hold
|
| Con |
 |
13,445 |
34.23% |
| Lab |
 |
20,804 |
52.97% |
| LD |
 |
4,089 |
10.41% |
| Oth |
 |
936 |
2.38% |
| Maj |
 |
7,359 |
18.74% |
| Turn |
 |
39,274 |
59.79% |
|
|
 |
Sylvia Heal
Labour hold
|
| LD |
Patrick Harley |
4,089 |
10.41% |
| L |
Sylvia Heal |
20,804 |
52.97% |
| C |
Les Jones |
13,445 |
34.23% |
| UK |
Alan Sheath |
936 |
2.38% |
|
Candidates representing 4 parties stood for election to this seat.
|
|
 |
Sylvia Heal
Labour gain
|
| Con |
 |
16,029 |
32.87% |
| Lab |
 |
26,366 |
54.07% |
| LD |
 |
4,169 |
8.55% |
| Ref |
 |
1,244 |
2.55% |
| Oth |
 |
953 |
1.95% |
| Maj |
 |
10,337 |
21.20% |
| Turn |
 |
48,761 |
73.61% |
|
|
 |
|
Conservative
|
| Con |
 |
24,306 |
44.70% |
| Lab |
 |
24,181 |
44.50% |
| LD |
 |
5,384 |
9.90% |
| Oth |
 |
452 |
0.80% |
| Maj |
 |
125 |
0.20% |
| Turn |
 |
54,323 |
79.40% |
|
|
 |
|

|

