|
Halifax
Labour hold

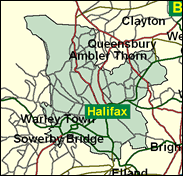
Although the dramatic and hilly West Yorkshire former mill town of Halifax appears safe for Labour, they actually did unusually badly if the votes cast within the seat for the Euro-elections of June 1999 are added up, lagging more than 10 per cent behind the Conservatives. The turnout was of course wretched, reaching just over 18 per cent; but Labour were hammered in the 2000 Calderdale council elections here too, and will need their best result since 1997 to avoid a shock defeat, their first in Halifax since the dire year of 1983.

Alice Mahon, a Campaign Grouper, is a woman-for-all-revolts against the Blair government, as she was against the leadership in opposition between 1992 and 1997 when only three Labour MPs were more active as dissidents. A small, poker-faced, feminist class warrior, whose opposition to the bombing of Serbia earned from Clare Short a comparison with the appeasers of Hitler, she was born 1937, educated at Halifax Grammar School and, as a mature student, Bradford University. She worked in manual jobs, as an auxiliary nurse and as a college lecturer before election for Halifax in 1987.
 |
| Wealthy Achievers, Suburban Areas |
4.07% |
14.99% |
27.14 |
|
| Affluent Greys, Rural Communities |
0.00% |
2.13% |
0.00 |
|
| Prosperous Pensioners, Retirement Areas |
0.04% |
2.49% |
1.70 |
|
| Affluent Executives, Family Areas |
0.60% |
4.43% |
13.48 |
|
| Well-Off Workers, Family Areas |
6.77% |
7.27% |
93.04 |
|
| Affluent Urbanites, Town & City Areas |
2.60% |
2.56% |
101.49 |
|
| Prosperous Professionals, Metropolitan Areas |
0.00% |
2.04% |
0.00 |
|
| Better-Off Executives, Inner City Areas |
1.30% |
3.94% |
33.03 |
|
| Comfortable Middle Agers, Mature Home Owning Areas |
9.63% |
13.04% |
73.86 |
|
| Skilled Workers, Home Owning Areas |
32.76% |
12.70% |
257.88 |
|
| New Home Owners, Mature Communities |
2.77% |
8.14% |
34.01 |
|
| White Collar Workers, Better-Off Multi Ethnic Areas |
3.70% |
4.02% |
92.10 |
|
| Older People, Less Prosperous Areas |
5.52% |
3.19% |
173.15 |
|
| Council Estate Residents, Better-Off Homes |
16.00% |
11.31% |
141.44 |
|
| Council Estate Residents, High Unemployment |
4.01% |
3.06% |
130.87 |
|
| Council Estate Residents, Greatest Hardship |
5.73% |
2.52% |
227.45 |
|
| People in Multi-Ethnic, Low-Income Areas |
4.46% |
2.10% |
212.46 |
|
| Unclassified |
0.05% |
0.06% |
76.07 |
|
|
 |
 |
 |
| £0-5K |
12.03% |
9.41% |
127.83 |
|
| £5-10K |
19.91% |
16.63% |
119.70 |
|
| £10-15K |
18.46% |
16.58% |
111.37 |
|
| £15-20K |
14.08% |
13.58% |
103.65 |
|
| £20-25K |
10.05% |
10.39% |
96.71 |
|
| £25-30K |
7.04% |
7.77% |
90.57 |
|
| £30-35K |
4.93% |
5.79% |
85.17 |
|
| £35-40K |
3.48% |
4.33% |
80.40 |
|
| £40-45K |
2.49% |
3.27% |
76.20 |
|
| £45-50K |
1.80% |
2.48% |
72.46 |
|
| £50-55K |
1.32% |
1.90% |
69.13 |
|
| £55-60K |
0.98% |
1.47% |
66.15 |
|
| £60-65K |
0.73% |
1.15% |
63.46 |
|
| £65-70K |
0.55% |
0.91% |
61.03 |
|
| £70-75K |
0.42% |
0.72% |
58.82 |
|
| £75-80K |
0.33% |
0.57% |
56.80 |
|
| £80-85K |
0.25% |
0.46% |
54.95 |
|
| £85-90K |
0.20% |
0.37% |
53.24 |
|
| £90-95K |
0.16% |
0.31% |
51.67 |
|
| £95-100K |
0.13% |
0.25% |
50.21 |
|
| £100K + |
0.58% |
1.34% |
42.99 |
|
|
|

|


|
1992-1997
|
1997-2001
|
|
|
|
| Con |
-10.55% |
| Lab |
10.83% |
| LD |
-0.72% |
|
| Con |
1.70% |
| Lab |
-5.30% |
| LD |
2.57% |
|
|
 |
Alice Mahon
Labour hold
|
| Con |
 |
13,671 |
33.85% |
| Lab |
 |
19,800 |
49.02% |
| LD |
 |
5,878 |
14.55% |
| Oth |
 |
1,041 |
2.58% |
| Maj |
 |
6,129 |
15.17% |
| Turn |
 |
40,390 |
3879.92% |
|
|
 |
Alice Mahon
Labour hold
|
| LD |
John Durkin |
5,878 |
14.55% |
| L |
Alice Mahon |
19,800 |
49.02% |
| UK |
Helen Martinek |
1,041 |
2.58% |
| C |
James Wales |
13,671 |
33.85% |
|
Candidates representing 4 parties stood for election to this seat.
|
|
 |
Alice Mahon
Labour
|
| Con |
 |
16,253 |
32.15% |
| Lab |
 |
27,465 |
54.33% |
| LD |
 |
6,059 |
11.98% |
| Ref |
|
0 |
0.00% |
| Oth |
 |
779 |
1.54% |
| Maj |
 |
11,212 |
22.18% |
| Turn |
 |
50,556 |
70.51% |
|
|
 |
|
Labour
|
| Con |
 |
24,637 |
42.70% |
| Lab |
 |
25,115 |
43.50% |
| LD |
 |
7,364 |
12.70% |
| Oth |
 |
649 |
1.10% |
| Maj |
 |
478 |
0.80% |
| Turn |
 |
57,765 |
78.00% |
|
|
 |
|

|

