|
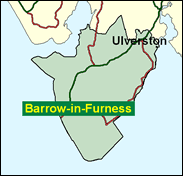
Barrow & Furness
Labour hold

Barrow and Furness was one of the many seats in which the Conservatives polled more votes than Labour in the June 1999 Euro-elections, albeit on a turnout of only 20.4pc, down 51.6pc on the General election. But the allegiances of this seat of volatile swings can never be taken totally for granted. Barrow is best known for its association with Vickers as a shipbuilding centre and port, and especially with Britain's nuclear submarine force. This defence connection may have helped the Conservatives to win the seat in 1983 and 1987, the years of Thatcher's landslides. By 1997 John Hutton's majority for Labour had increased to 30pc, but this is an independently minded town tucked away beyond the Lake District hills, and it can never be taken entirely for granted.

A staunch Blairite elected in 1992, John Hutton, a health minister by 1998, is a gaunt-looking introvert, who as MP for Barrow prudently defends the local defence industry by urging more Trident nuclear submarines. A former law lecturer at Newcastle Poly, he was born in 1955 and was educated at Westcliffe High School, Essex, and Magdalen College, Oxford. His boss at Health, Alan Millburn, is his former flatmate, and another rising Blairite, Stephen Byers is a former colleague at Newcastle Poly.
 |
| Wealthy Achievers, Suburban Areas |
6.09% |
14.99% |
40.60 |
|
| Affluent Greys, Rural Communities |
0.00% |
2.13% |
0.00 |
|
| Prosperous Pensioners, Retirement Areas |
0.69% |
2.49% |
27.58 |
|
| Affluent Executives, Family Areas |
0.50% |
4.43% |
11.25 |
|
| Well-Off Workers, Family Areas |
6.29% |
7.27% |
86.47 |
|
| Affluent Urbanites, Town & City Areas |
0.03% |
2.56% |
1.21 |
|
| Prosperous Professionals, Metropolitan Areas |
0.00% |
2.04% |
0.00 |
|
| Better-Off Executives, Inner City Areas |
0.28% |
3.94% |
7.10 |
|
| Comfortable Middle Agers, Mature Home Owning Areas |
10.06% |
13.04% |
77.16 |
|
| Skilled Workers, Home Owning Areas |
53.35% |
12.70% |
419.98 |
|
| New Home Owners, Mature Communities |
6.02% |
8.14% |
73.88 |
|
| White Collar Workers, Better-Off Multi Ethnic Areas |
2.03% |
4.02% |
50.57 |
|
| Older People, Less Prosperous Areas |
1.81% |
3.19% |
56.76 |
|
| Council Estate Residents, Better-Off Homes |
6.79% |
11.31% |
60.04 |
|
| Council Estate Residents, High Unemployment |
2.78% |
3.06% |
90.88 |
|
| Council Estate Residents, Greatest Hardship |
3.29% |
2.52% |
130.54 |
|
| People in Multi-Ethnic, Low-Income Areas |
0.00% |
2.10% |
0.00 |
|
| Unclassified |
0.00% |
0.06% |
0.00 |
|
|
 |
 |
 |
| £0-5K |
12.05% |
9.41% |
127.98 |
|
| £5-10K |
21.29% |
16.63% |
127.98 |
|
| £10-15K |
19.65% |
16.58% |
118.51 |
|
| £15-20K |
14.58% |
13.58% |
107.33 |
|
| £20-25K |
10.05% |
10.39% |
96.66 |
|
| £25-30K |
6.78% |
7.77% |
87.15 |
|
| £30-35K |
4.57% |
5.79% |
78.90 |
|
| £35-40K |
3.11% |
4.33% |
71.82 |
|
| £40-45K |
2.15% |
3.27% |
65.74 |
|
| £45-50K |
1.50% |
2.48% |
60.52 |
|
| £50-55K |
1.07% |
1.90% |
56.01 |
|
| £55-60K |
0.77% |
1.47% |
52.09 |
|
| £60-65K |
0.56% |
1.15% |
48.67 |
|
| £65-70K |
0.41% |
0.91% |
45.66 |
|
| £70-75K |
0.31% |
0.72% |
43.00 |
|
| £75-80K |
0.23% |
0.57% |
40.64 |
|
| £80-85K |
0.18% |
0.46% |
38.53 |
|
| £85-90K |
0.14% |
0.37% |
36.63 |
|
| £90-95K |
0.11% |
0.31% |
34.91 |
|
| £95-100K |
0.08% |
0.25% |
33.35 |
|
| £100K + |
0.35% |
1.34% |
26.35 |
|
|
|

|


|
1992-1997
|
1997-2001
|
|
|
|
| Con |
-14.07% |
| Lab |
9.59% |
| LD |
-2.06% |
|
| Con |
3.10% |
| Lab |
-1.61% |
| LD |
3.33% |
|
|
 |
John Hutton
Labour hold
|
| Con |
 |
11,835 |
30.33% |
| Lab |
 |
21,724 |
55.67% |
| LD |
 |
4,750 |
12.17% |
| Oth |
 |
711 |
1.82% |
| Maj |
 |
9,889 |
25.34% |
| Turn |
 |
39,020 |
60.27% |
|
|
 |
John Hutton
Labour hold
|
| C |
James Airey |
11,835 |
30.33% |
| L |
John Hutton |
21,724 |
55.67% |
| LD |
Barry Rabone |
4,750 |
12.17% |
| UK |
John Smith |
711 |
1.82% |
|
Candidates representing 4 parties stood for election to this seat.
|
|
 |
John Hutton
Labour
|
| Con |
 |
13,133 |
27.23% |
| Lab |
 |
27,630 |
57.29% |
| LD |
 |
4,264 |
8.84% |
| Ref |
 |
1,208 |
2.50% |
| Oth |
 |
1,995 |
4.14% |
| Maj |
 |
14,497 |
30.06% |
| Turn |
 |
48,230 |
72.03% |
|
|
 |
|
Labour
|
| Con |
 |
22,990 |
41.30% |
| Lab |
 |
26,568 |
47.70% |
| LD |
 |
6,089 |
10.90% |
| Oth |
|
0 |
0.00% |
| Maj |
 |
3,578 |
6.40% |
| Turn |
 |
55,647 |
80.50% |
|
|
 |
|

|

