|
Haltemprice & Howden
Conservative hold

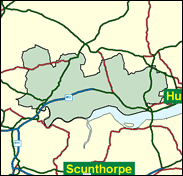
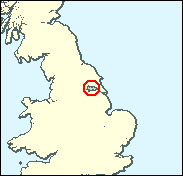
This is a coupling of two names previously associated with Tory seats in East Yorkshire, though of different kinds. Haltemprice represents the middle class suburbs to the west and north of Hull, whose boundaries are drawn tightly enough to leave an overwhelmingly working class core, with three very solid Labour seats. Howden is much more rural, containing the flat lands north of the Ouse but south of the Wolds. It could have hardly been drawn better for the ambitious and widely touted Conservative MP David Davis, as there are no solid blocs of opposition at local or national level.

David Davis, MP here since 1997 and before that for contiguous Boothferry from 1987, is seen as a potential dark horse in any future Tory leadership race, despite his absence from the front line, as traditionally non-partisan chairman of the Public Accounts Committee, a post he deliberately sought away from the civil war among other would-be Tory leaders. As whipper-in against the Maastricht rebels, he earned a reputation as a careerist sacrificing Eurosceptic principles, but memories fade and his classless manner and conventional good looks do not count against him. Born 1948 and educated at Bec Grammar School, Warwick University, London Business School and Harvard, he worked as a Tate & Lyle executive for 13 years.
 |
| Wealthy Achievers, Suburban Areas |
38.57% |
14.99% |
257.24 |
|
| Affluent Greys, Rural Communities |
3.48% |
2.13% |
163.62 |
|
| Prosperous Pensioners, Retirement Areas |
2.25% |
2.49% |
90.66 |
|
| Affluent Executives, Family Areas |
1.42% |
4.43% |
32.05 |
|
| Well-Off Workers, Family Areas |
12.01% |
7.27% |
165.06 |
|
| Affluent Urbanites, Town & City Areas |
0.00% |
2.56% |
0.05 |
|
| Prosperous Professionals, Metropolitan Areas |
0.03% |
2.04% |
1.34 |
|
| Better-Off Executives, Inner City Areas |
0.14% |
3.94% |
3.52 |
|
| Comfortable Middle Agers, Mature Home Owning Areas |
21.32% |
13.04% |
163.50 |
|
| Skilled Workers, Home Owning Areas |
10.04% |
12.70% |
79.07 |
|
| New Home Owners, Mature Communities |
5.92% |
8.14% |
72.75 |
|
| White Collar Workers, Better-Off Multi Ethnic Areas |
0.00% |
4.02% |
0.00 |
|
| Older People, Less Prosperous Areas |
2.89% |
3.19% |
90.79 |
|
| Council Estate Residents, Better-Off Homes |
1.78% |
11.31% |
15.71 |
|
| Council Estate Residents, High Unemployment |
0.08% |
3.06% |
2.59 |
|
| Council Estate Residents, Greatest Hardship |
0.00% |
2.52% |
0.00 |
|
| People in Multi-Ethnic, Low-Income Areas |
0.00% |
2.10% |
0.00 |
|
| Unclassified |
0.07% |
0.06% |
112.22 |
|
|
 |
|
|
| £0-5K |
6.67% |
9.41% |
70.83 |
|
| £5-10K |
13.12% |
16.63% |
78.86 |
|
| £10-15K |
14.77% |
16.58% |
89.07 |
|
| £15-20K |
13.36% |
13.58% |
98.39 |
|
| £20-25K |
11.03% |
10.39% |
106.13 |
|
| £25-30K |
8.73% |
7.77% |
112.34 |
|
| £30-35K |
6.79% |
5.79% |
117.25 |
|
| £35-40K |
5.25% |
4.33% |
121.11 |
|
| £40-45K |
4.05% |
3.27% |
124.13 |
|
| £45-50K |
3.14% |
2.48% |
126.49 |
|
| £50-55K |
2.44% |
1.90% |
128.31 |
|
| £55-60K |
1.91% |
1.47% |
129.71 |
|
| £60-65K |
1.51% |
1.15% |
130.77 |
|
| £65-70K |
1.19% |
0.91% |
131.55 |
|
| £70-75K |
0.95% |
0.72% |
132.10 |
|
| £75-80K |
0.76% |
0.57% |
132.46 |
|
| £80-85K |
0.61% |
0.46% |
132.66 |
|
| £85-90K |
0.50% |
0.37% |
132.74 |
|
| £90-95K |
0.40% |
0.31% |
132.70 |
|
| £95-100K |
0.33% |
0.25% |
132.57 |
|
| £100K + |
1.74% |
1.34% |
129.35 |
|
|
|
|


|
1992-1997
|
1997-2001
|
|
|
|
| Con |
-15.29% |
| Lab |
8.31% |
| LD |
3.65% |
|
| Con |
-0.78% |
| Lab |
-7.91% |
| LD |
10.06% |
|
|
|
David Davis
Conservative hold
|
| Con |
 |
18,994 |
43.24% |
| Lab |
 |
6,898 |
15.70% |
| LD |
 |
17,091 |
38.91% |
| Oth |
 |
945 |
2.15% |
| Maj |
 |
1,903 |
4.33% |
| Turn |
|
43,928 |
65.51% |
|
|
|
David Davis
Conservative hold
|
| C |
David Davis |
18,994 |
43.24% |
| L |
Leslie Howell |
6,898 |
15.70% |
| LD |
John Neal |
17,091 |
38.91% |
| UK |
Joanne Robinson |
945 |
2.15% |
|
Candidates representing 4 parties stood for election to this seat.
|
|
|
David Davis
Conservative
|
| Con |
|
21,809 |
44.01% |
| Lab |
|
11,701 |
23.61% |
| LD |
|
14,295 |
28.85% |
| Ref |
 |
1,370 |
2.76% |
| Oth |
|
375 |
0.76% |
| Maj |
|
7,514 |
15.16% |
| Turn |
|
49,550 |
75.53% |
|
|
|
|
Conservative
|
| Con |
|
30,085 |
59.30% |
| Lab |
|
7,774 |
15.30% |
| LD |
|
12,772 |
25.20% |
| Oth |
|
110 |
0.20% |
| Maj |
|
17,313 |
34.10% |
| Turn |
|
50,741 |
79.23% |
|
|
|
|
|