|
Halton
Labour hold

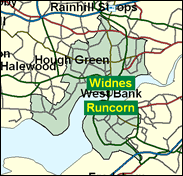
A very safe Labour seat, Halton brings together both banks of the Mersey, now linked by a major road bridge heading towards Liverpool, so that there is no need to take the old ferry once immortalised by the music hall entertainer Stanley Holloway as costing "per 2d per person per trip". Both ends of this voyage find Labour strongholds: to the north, formerly in Lancashire but now anomalously placed for administrative purposes in Cheshire, Widnes with its distinctive chemical works; to the south, the New Town of Runcorn, which has a decidedly Merseyside accent and flavour.

Derek Twigg, PPS to Helen Liddell, is a model Blairite as a loyalist stooge questioner. Born locally (1959), he is as local as local gets, educated at Bankfield High School, Widnes, and at Halton FE College, and serving as a Halton district councillor for 14 years. He worked as a Department of Employment civil servant before election here in 1997.
 |
| Wealthy Achievers, Suburban Areas |
8.28% |
14.99% |
55.24 |
|
| Affluent Greys, Rural Communities |
0.00% |
2.13% |
0.00 |
|
| Prosperous Pensioners, Retirement Areas |
0.00% |
2.49% |
0.00 |
|
| Affluent Executives, Family Areas |
5.33% |
4.43% |
120.47 |
|
| Well-Off Workers, Family Areas |
12.06% |
7.27% |
165.75 |
|
| Affluent Urbanites, Town & City Areas |
0.41% |
2.56% |
15.96 |
|
| Prosperous Professionals, Metropolitan Areas |
0.00% |
2.04% |
0.00 |
|
| Better-Off Executives, Inner City Areas |
0.00% |
3.94% |
0.00 |
|
| Comfortable Middle Agers, Mature Home Owning Areas |
7.36% |
13.04% |
56.44 |
|
| Skilled Workers, Home Owning Areas |
25.32% |
12.70% |
199.34 |
|
| New Home Owners, Mature Communities |
6.65% |
8.14% |
81.65 |
|
| White Collar Workers, Better-Off Multi Ethnic Areas |
0.00% |
4.02% |
0.00 |
|
| Older People, Less Prosperous Areas |
3.34% |
3.19% |
105.01 |
|
| Council Estate Residents, Better-Off Homes |
26.13% |
11.31% |
231.05 |
|
| Council Estate Residents, High Unemployment |
0.38% |
3.06% |
12.46 |
|
| Council Estate Residents, Greatest Hardship |
4.72% |
2.52% |
187.53 |
|
| People in Multi-Ethnic, Low-Income Areas |
0.00% |
2.10% |
0.00 |
|
| Unclassified |
0.01% |
0.06% |
15.45 |
|
|
 |
 |
 |
| £0-5K |
11.02% |
9.41% |
117.06 |
|
| £5-10K |
19.25% |
16.63% |
115.75 |
|
| £10-15K |
18.38% |
16.58% |
110.85 |
|
| £15-20K |
14.30% |
13.58% |
105.30 |
|
| £20-25K |
10.37% |
10.39% |
99.78 |
|
| £25-30K |
7.35% |
7.77% |
94.49 |
|
| £30-35K |
5.19% |
5.79% |
89.52 |
|
| £35-40K |
3.68% |
4.33% |
84.91 |
|
| £40-45K |
2.63% |
3.27% |
80.63 |
|
| £45-50K |
1.90% |
2.48% |
76.68 |
|
| £50-55K |
1.39% |
1.90% |
73.03 |
|
| £55-60K |
1.03% |
1.47% |
69.67 |
|
| £60-65K |
0.77% |
1.15% |
66.57 |
|
| £65-70K |
0.58% |
0.91% |
63.71 |
|
| £70-75K |
0.44% |
0.72% |
61.07 |
|
| £75-80K |
0.34% |
0.57% |
58.63 |
|
| £80-85K |
0.26% |
0.46% |
56.37 |
|
| £85-90K |
0.20% |
0.37% |
54.28 |
|
| £90-95K |
0.16% |
0.31% |
52.34 |
|
| £95-100K |
0.13% |
0.25% |
50.54 |
|
| £100K + |
0.57% |
1.34% |
42.05 |
|
|
|

|


|
1992-1997
|
1997-2001
|
|
|
|
| Con |
-12.64% |
| Lab |
11.28% |
| LD |
-1.46% |
|
| Con |
0.95% |
| Lab |
-1.71% |
| LD |
4.89% |
|
|
 |
Derek Twigg
Labour hold
|
| Con |
 |
6,413 |
18.60% |
| Lab |
 |
23,841 |
69.16% |
| LD |
 |
4,216 |
12.23% |
| Oth |
|
0 |
0.00% |
| Maj |
 |
17,428 |
50.56% |
| Turn |
 |
34,470 |
54.14% |
|
|
 |
Derek Twigg
Labour hold
|
| C |
Chris Davenport |
6,413 |
18.60% |
| L |
Derek Twigg |
23,841 |
69.16% |
| LD |
Peter Walker |
4,216 |
12.23% |
|
Candidates representing 3 parties stood for election to this seat.
|
|
 |
Derek Twigg
Labour
|
| Con |
 |
7,847 |
17.66% |
| Lab |
 |
31,497 |
70.88% |
| LD |
 |
3,263 |
7.34% |
| Ref |
 |
1,036 |
2.33% |
| Oth |
 |
796 |
1.79% |
| Maj |
 |
23,650 |
53.22% |
| Turn |
 |
44,439 |
68.38% |
|
|
 |
|
Labour
|
| Con |
 |
15,426 |
30.30% |
| Lab |
 |
30,363 |
59.60% |
| LD |
 |
4,499 |
8.80% |
| Oth |
 |
637 |
1.30% |
| Maj |
 |
14,937 |
29.30% |
| Turn |
 |
50,925 |
76.94% |
|
|
 |
|

|

