|
Hamilton North and Bellshill
Labour hold

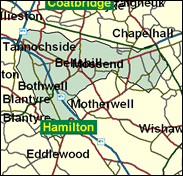
One of the phalanx of safe Labour seats in the heavily urbanised and industrialised belt of Central Scotland, this is the sort of seat which may well disappear in the boundary changes and will reduce the number of Scottish seats: now that they have their own Parliament, there is no justification at all for their smaller than average electorates (53,000 here). This looks like a collection of loose ends in any case. In spite of the name, virtually none of the town of Hamilton itself, but rather a number of medium sized communities, homogeneously working class and with more council tenants than owner-occupiers, such as Bothwell, Uddingston, Mossend, Viewpark, Orbiston, Birkenshaw, New Stevenston, Holytown, Newarthill and Bellshill itself, the home town of someone who shot across the skies of Britain like a comet in 1980 before finding a new home and a new accent in Las Vegas: Sheena Easton.

Dr John Reid, Northern Ireland Secretary after Mandelson's exit, is in his fourth government post since 1997. A combative debater, well-versed in the political arts, he has shown himself a deft spokesman for the government, especially whilst in the time-on-his-hands small post-devolution job of Scottish Secretary. Born 1947, the first Catholic to be sent to the Ulster salt mines, he says of his school, St. Patrick's (RC) Secondary, Coatbridge, which also produced the Labour MPs Helen Liddell and Michael Connarty: "It doesn't quite beat Eton, but we are ahead of Fettes." His doctorate is in economic history from Stirling University. When Mandelson got the Northern Ireland job Reid said of the Unionists, "They got the gay." Well, now they've got the Catholic. Of combative bent, he has rejected as "unbalanced theorising" the Parliamentary Standards Commissioner's report on his alleged misuse of parliamentary researchers for Labour Party work and alleged threatening of witnesses involved.
 |
| Wealthy Achievers, Suburban Areas |
5.55% |
14.99% |
37.03 |
|
| Affluent Greys, Rural Communities |
0.00% |
2.13% |
0.00 |
|
| Prosperous Pensioners, Retirement Areas |
0.56% |
2.49% |
22.58 |
|
| Affluent Executives, Family Areas |
7.07% |
4.43% |
159.75 |
|
| Well-Off Workers, Family Areas |
11.29% |
7.27% |
155.19 |
|
| Affluent Urbanites, Town & City Areas |
3.68% |
2.56% |
143.45 |
|
| Prosperous Professionals, Metropolitan Areas |
0.63% |
2.04% |
30.69 |
|
| Better-Off Executives, Inner City Areas |
1.24% |
3.94% |
31.55 |
|
| Comfortable Middle Agers, Mature Home Owning Areas |
1.30% |
13.04% |
9.97 |
|
| Skilled Workers, Home Owning Areas |
2.37% |
12.70% |
18.69 |
|
| New Home Owners, Mature Communities |
5.03% |
8.14% |
61.79 |
|
| White Collar Workers, Better-Off Multi Ethnic Areas |
0.53% |
4.02% |
13.17 |
|
| Older People, Less Prosperous Areas |
2.57% |
3.19% |
80.65 |
|
| Council Estate Residents, Better-Off Homes |
40.07% |
11.31% |
354.23 |
|
| Council Estate Residents, High Unemployment |
6.87% |
3.06% |
224.21 |
|
| Council Estate Residents, Greatest Hardship |
11.24% |
2.52% |
446.42 |
|
| People in Multi-Ethnic, Low-Income Areas |
0.00% |
2.10% |
0.00 |
|
| Unclassified |
0.00% |
0.06% |
0.00 |
|
|
 |
 |
 |
| £0-5K |
9.84% |
9.41% |
104.51 |
|
| £5-10K |
16.79% |
16.63% |
100.97 |
|
| £10-15K |
16.55% |
16.58% |
99.81 |
|
| £15-20K |
13.62% |
13.58% |
100.24 |
|
| £20-25K |
10.51% |
10.39% |
101.15 |
|
| £25-30K |
7.92% |
7.77% |
101.91 |
|
| £30-35K |
5.92% |
5.79% |
102.21 |
|
| £35-40K |
4.42% |
4.33% |
101.98 |
|
| £40-45K |
3.31% |
3.27% |
101.25 |
|
| £45-50K |
2.48% |
2.48% |
100.10 |
|
| £50-55K |
1.88% |
1.90% |
98.62 |
|
| £55-60K |
1.43% |
1.47% |
96.91 |
|
| £60-65K |
1.09% |
1.15% |
95.03 |
|
| £65-70K |
0.84% |
0.91% |
93.05 |
|
| £70-75K |
0.65% |
0.72% |
91.02 |
|
| £75-80K |
0.51% |
0.57% |
88.97 |
|
| £80-85K |
0.40% |
0.46% |
86.94 |
|
| £85-90K |
0.32% |
0.37% |
84.94 |
|
| £90-95K |
0.25% |
0.31% |
82.99 |
|
| £95-100K |
0.20% |
0.25% |
81.10 |
|
| £100K + |
0.95% |
1.34% |
70.40 |
|
|
|

|


|
1992-1997
|
1997-2001
|
|
|
|
| Con |
-4.82% |
| Lab |
5.71% |
| LD |
-1.74% |
| SNP |
-0.61% |
|
| Con |
-1.67% |
| Lab |
-2.22% |
| LD |
2.70% |
| SNP |
-1.91% |
|
|
 |
John Reid
Labour hold
|
| Con |
 |
2,649 |
8.71% |
| Lab |
 |
18,786 |
61.79% |
| LD |
 |
2,360 |
7.76% |
| SNP |
 |
5,225 |
17.19% |
| Oth |
 |
1,384 |
4.55% |
| Maj |
 |
13,561 |
44.60% |
| Turn |
 |
30,404 |
56.79% |
|
|
 |
John Reid
Labour hold
|
| SSP |
Shareen Blackall |
1,189 |
3.91% |
| C |
Bill Frain |
2,649 |
8.71% |
| LD |
Keith Legg |
2,360 |
7.76% |
| SL |
Steve Mayes |
195 |
0.64% |
| L |
John Reid |
18,786 |
61.79% |
| SNP |
Chris Stephens |
5,225 |
17.19% |
|
Candidates representing 6 parties stood for election to this seat.
|
|
 |
John Reid
Labour
|
| Con |
 |
3,944 |
10.38% |
| Lab |
 |
24,322 |
64.01% |
| LD |
 |
1,924 |
5.06% |
| SNP |
 |
7,255 |
19.09% |
| Ref |
 |
554 |
1.46% |
| Oth |
|
0 |
0.00% |
| Maj |
 |
17,067 |
44.91% |
| Turn |
 |
37,999 |
70.88% |
|
|
 |
|
Labour
|
| Con |
 |
6,115 |
15.20% |
| Lab |
 |
23,422 |
58.30% |
| LD |
 |
2,715 |
6.80% |
| SNP |
 |
7,932 |
19.70% |
| Oth |
|
0 |
0.00% |
| Maj |
 |
15,490 |
38.50% |
| Turn |
 |
40,184 |
76.12% |
|
|
 |
|

|

