|
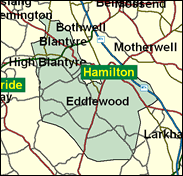
Hamilton South
Labour hold

The SNP ran Labour close in the by-election caused by George Robertson's double elevation to the House of Lords and the post of Secretary General of Nato in the second half of 1999, but it should be remembered that voters notoriously dislike contests triggered in midterm for what they may see as unnecessary elections (see for example how much better Labour did in defending Glasgow Anniesland following the death of Donald Dewar in late 2000). Labour had held on easily in the regularly scheduled Scottish parliament contest 1999 in Hamilton South in May, for example, and there is no reason to suppose that it will be particularly vulnerable at the next general election.

Bill Tynan narrowly squeaked in as George Robertson's successor here in 1999. A safe pair of union hands, as a toolmaker (of 27 years)-turned-AEEU-political-officer for 11 years, he was born 1940, educated at St. Mungo's Academy, Glasgow and Stow College (where he trained as a mechanical engineer). Gnarled, dour-looking and austere, he loyally looks forward to fighting on the Blair government's economic record and backs his Union boss Sir Ken Jackson's Europhile stance.
 |
| Wealthy Achievers, Suburban Areas |
4.54% |
14.99% |
30.30 |
|
| Affluent Greys, Rural Communities |
0.00% |
2.13% |
0.00 |
|
| Prosperous Pensioners, Retirement Areas |
0.00% |
2.49% |
0.00 |
|
| Affluent Executives, Family Areas |
5.50% |
4.43% |
124.33 |
|
| Well-Off Workers, Family Areas |
15.74% |
7.27% |
216.40 |
|
| Affluent Urbanites, Town & City Areas |
1.23% |
2.56% |
47.84 |
|
| Prosperous Professionals, Metropolitan Areas |
0.00% |
2.04% |
0.00 |
|
| Better-Off Executives, Inner City Areas |
0.40% |
3.94% |
10.08 |
|
| Comfortable Middle Agers, Mature Home Owning Areas |
3.47% |
13.04% |
26.63 |
|
| Skilled Workers, Home Owning Areas |
4.43% |
12.70% |
34.89 |
|
| New Home Owners, Mature Communities |
5.71% |
8.14% |
70.08 |
|
| White Collar Workers, Better-Off Multi Ethnic Areas |
0.01% |
4.02% |
0.29 |
|
| Older People, Less Prosperous Areas |
3.93% |
3.19% |
123.22 |
|
| Council Estate Residents, Better-Off Homes |
34.56% |
11.31% |
305.56 |
|
| Council Estate Residents, High Unemployment |
10.00% |
3.06% |
326.55 |
|
| Council Estate Residents, Greatest Hardship |
10.48% |
2.52% |
416.22 |
|
| People in Multi-Ethnic, Low-Income Areas |
0.00% |
2.10% |
0.00 |
|
| Unclassified |
0.00% |
0.06% |
0.00 |
|
|
 |
 |
 |
| £0-5K |
10.45% |
9.41% |
111.00 |
|
| £5-10K |
17.93% |
16.63% |
107.78 |
|
| £10-15K |
17.47% |
16.58% |
105.39 |
|
| £15-20K |
14.07% |
13.58% |
103.56 |
|
| £20-25K |
10.57% |
10.39% |
101.69 |
|
| £25-30K |
7.74% |
7.77% |
99.51 |
|
| £30-35K |
5.62% |
5.79% |
96.95 |
|
| £35-40K |
4.08% |
4.33% |
94.08 |
|
| £40-45K |
2.97% |
3.27% |
91.00 |
|
| £45-50K |
2.18% |
2.48% |
87.82 |
|
| £50-55K |
1.61% |
1.90% |
84.61 |
|
| £55-60K |
1.20% |
1.47% |
81.45 |
|
| £60-65K |
0.90% |
1.15% |
78.37 |
|
| £65-70K |
0.68% |
0.91% |
75.42 |
|
| £70-75K |
0.52% |
0.72% |
72.59 |
|
| £75-80K |
0.40% |
0.57% |
69.92 |
|
| £80-85K |
0.31% |
0.46% |
67.39 |
|
| £85-90K |
0.24% |
0.37% |
65.02 |
|
| £90-95K |
0.19% |
0.31% |
62.79 |
|
| £95-100K |
0.15% |
0.25% |
60.70 |
|
| £100K + |
0.68% |
1.34% |
50.74 |
|
|
|

|


|
1992-1997
|
1997-2001
|
|
|
|
| Con |
-7.46% |
| Lab |
8.60% |
| LD |
-1.48% |
| SNP |
-2.68% |
|
| Con |
-1.62% |
| Lab |
-5.92% |
| LD |
3.78% |
| SNP |
1.78% |
|
|
 |
Bill Tynan
Labour hold
|
| Con |
 |
1,876 |
7.01% |
| Lab |
 |
15,965 |
59.68% |
| LD |
 |
2,381 |
8.90% |
| SNP |
 |
5,190 |
19.40% |
| Oth |
 |
1,338 |
5.00% |
| Maj |
 |
10,775 |
40.28% |
| Turn |
 |
26,750 |
57.32% |
|
|
 |
Bill Tynan
Labour hold
|
| SSP |
Gena Mitchell |
1,187 |
4.44% |
| UK |
Janice Murdoch |
151 |
0.56% |
| LD |
John Oswald |
2,381 |
8.90% |
| C |
Neil Richardson |
1,876 |
7.01% |
| L |
Bill Tynan |
15,965 |
59.68% |
| SNP |
John Wilson |
5,190 |
19.40% |
|
Candidates representing 6 parties stood for election to this seat.
|
|
 |
|
By Election (23 September 1999)
|
|
Elevation of Rt Hon George Islay MacNeill Robertson to a Life Peerage - Lord Robertson of Port Ellen - 24 August 1999
|
Bill Tynan
Labour
|
| Con |
 |
1,406 |
7.23% |
| Lab |
 |
7,172 |
36.87% |
| LD |
 |
634 |
3.26% |
| SNP |
 |
6,616 |
34.01% |
| Oth |
 |
3,626 |
18.64% |
| Maj |
 |
556 |
2.86% |
| Turn |
 |
19,454 |
41.32% |
|
|
 |
George Robertson
Labour
|
| Con |
 |
2,858 |
8.64% |
| Lab |
 |
21,709 |
65.60% |
| LD |
 |
1,693 |
5.12% |
| SNP |
 |
5,831 |
17.62% |
| Ref |
 |
316 |
0.95% |
| Oth |
 |
684 |
2.07% |
| Maj |
 |
15,878 |
47.98% |
| Turn |
 |
33,091 |
71.07% |
|
|
 |
|
Labour
|
| Con |
 |
5,596 |
16.10% |
| Lab |
 |
19,816 |
57.00% |
| LD |
 |
2,308 |
6.60% |
| SNP |
 |
7,074 |
20.30% |
| Oth |
|
0 |
0.00% |
| Maj |
 |
12,742 |
36.60% |
| Turn |
 |
34,794 |
74.25% |
|
|
 |
|

|

