|
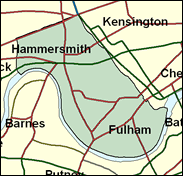
Hammersmith & Fulham
Labour hold

A largely affluent inner London seat (yes, there are a few of those), Hammersmith and Fulham will again prove a hard fought marginal next time, but the only recent evidence as to its outcome lies in the European elections (broken down to constituency level) of June 1999. These were fought largely on a single (pro-Tory) issue, and with a very low turnout (less than 25 per cent) here. For what it is worth, the Conservative regional list obtained five per cent more than Labour, which was fairly typical for a marginal London seat.

Ian Coleman, Labour's Old Tonbridgean MP here since 1997, is an unobtrusive loyalist despite an earlier leftist reputation as leader of Hammersmith & Fulham Council, and opposition to the Clause 4 redraft. Posing only two written questions in his first year, he has not featured in lists of rebellious votes against the Government. Matthew Carrington, the defeated Tory in 1997, is back as one of 12 would-be retread MPs in the top 75 Conservative targets. His parliamentary career began as MP for Fulham 1987-97, and ended with his loss of the merged Hammersmith & Fulham seat in 1997. He rose to Assistant Whip at the fag end of the Major government, having earlier been PPS to John Patten until Patten was dropped in 1994. A former banker, mostly with the Saudi International Bank in London, educated at the London Lycee Francais and Imperial College, he has backed 16 as the homosexual age of consent.
 |
| Wealthy Achievers, Suburban Areas |
0.00% |
14.99% |
0.00 |
|
| Affluent Greys, Rural Communities |
0.04% |
2.13% |
1.65 |
|
| Prosperous Pensioners, Retirement Areas |
0.27% |
2.49% |
10.95 |
|
| Affluent Executives, Family Areas |
0.03% |
4.43% |
0.64 |
|
| Well-Off Workers, Family Areas |
0.04% |
7.27% |
0.49 |
|
| Affluent Urbanites, Town & City Areas |
8.33% |
2.56% |
324.82 |
|
| Prosperous Professionals, Metropolitan Areas |
32.89% |
2.04% |
1,611.55 |
|
| Better-Off Executives, Inner City Areas |
38.48% |
3.94% |
975.64 |
|
| Comfortable Middle Agers, Mature Home Owning Areas |
0.01% |
13.04% |
0.06 |
|
| Skilled Workers, Home Owning Areas |
0.00% |
12.70% |
0.00 |
|
| New Home Owners, Mature Communities |
0.00% |
8.14% |
0.00 |
|
| White Collar Workers, Better-Off Multi Ethnic Areas |
2.38% |
4.02% |
59.28 |
|
| Older People, Less Prosperous Areas |
0.00% |
3.19% |
0.00 |
|
| Council Estate Residents, Better-Off Homes |
0.00% |
11.31% |
0.00 |
|
| Council Estate Residents, High Unemployment |
9.18% |
3.06% |
299.75 |
|
| Council Estate Residents, Greatest Hardship |
0.00% |
2.52% |
0.00 |
|
| People in Multi-Ethnic, Low-Income Areas |
8.36% |
2.10% |
398.00 |
|
| Unclassified |
0.00% |
0.06% |
0.00 |
|
|
 |
|
|
| £0-5K |
4.98% |
9.41% |
52.89 |
|
| £5-10K |
9.66% |
16.63% |
58.07 |
|
| £10-15K |
11.51% |
16.58% |
69.43 |
|
| £15-20K |
11.26% |
13.58% |
82.86 |
|
| £20-25K |
10.09% |
10.39% |
97.05 |
|
| £25-30K |
8.66% |
7.77% |
111.38 |
|
| £30-35K |
7.27% |
5.79% |
125.54 |
|
| £35-40K |
6.04% |
4.33% |
139.36 |
|
| £40-45K |
4.99% |
3.27% |
152.74 |
|
| £45-50K |
4.11% |
2.48% |
165.65 |
|
| £50-55K |
3.39% |
1.90% |
178.08 |
|
| £55-60K |
2.80% |
1.47% |
190.04 |
|
| £60-65K |
2.32% |
1.15% |
201.54 |
|
| £65-70K |
1.93% |
0.91% |
212.61 |
|
| £70-75K |
1.61% |
0.72% |
223.27 |
|
| £75-80K |
1.34% |
0.57% |
233.54 |
|
| £80-85K |
1.13% |
0.46% |
243.45 |
|
| £85-90K |
0.95% |
0.37% |
253.02 |
|
| £90-95K |
0.80% |
0.31% |
262.28 |
|
| £95-100K |
0.68% |
0.25% |
271.23 |
|
| £100K + |
4.37% |
1.34% |
325.08 |
|
|
|
|


|
1992-1997
|
1997-2001
|
|
|
|
| Con |
-11.95% |
| Lab |
8.16% |
| LD |
0.45% |
|
| Con |
0.14% |
| Lab |
-2.46% |
| LD |
3.09% |
|
|
|
Iain Coleman
Labour hold
|
| Con |
 |
17,786 |
39.79% |
| Lab |
 |
19,801 |
44.30% |
| LD |
 |
5,294 |
11.84% |
| Oth |
 |
1,819 |
4.07% |
| Maj |
 |
2,015 |
4.51% |
| Turn |
|
44,700 |
56.37% |
|
|
|
Iain Coleman
Labour hold
|
| LD |
John Burden |
5,294 |
11.84% |
| C |
Matthew Carrington |
17,786 |
39.79% |
| L |
Iain Coleman |
19,801 |
44.30% |
| G |
Daniel Lopez Dias |
1,444 |
3.23% |
| UK |
Gerald Roberts |
375 |
0.84% |
|
Candidates representing 5 parties stood for election to this seat.
|
|
|
Iain Colman
Labour gain
|
| Con |
|
21,420 |
39.65% |
| Lab |
|
25,262 |
46.76% |
| LD |
|
4,728 |
8.75% |
| Ref |
 |
1,023 |
1.89% |
| Oth |
|
1,593 |
2.95% |
| Maj |
|
3,842 |
7.11% |
| Turn |
|
54,026 |
68.70% |
|
|
|
|
Conservative
|
| Con |
|
28,487 |
51.60% |
| Lab |
|
21,313 |
38.60% |
| LD |
|
4,553 |
8.30% |
| Oth |
|
820 |
1.50% |
| Maj |
|
7,174 |
13.00% |
| Turn |
|
55,173 |
75.86% |
|
|
|
|
|