|
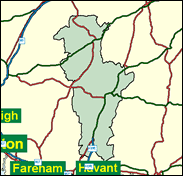
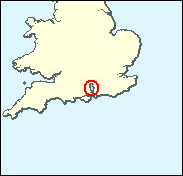
Hampshire East
Conservative hold

Apparently made up of the leftovers from other seats as Hampshire has frequently had to have its boundaries redrawn due to the most rapid population growth in absolute terms of any county in Britain, East Hampshire is a very safe Conservative seat. Less than 40 of these retained an overall majority in the five figure range in the 1997 election, but Michael Mates's seat comfortably did so. It ranges from the country town of Petersfield and the suburbs of Havant in the south up to Alton and the nearby villages which were formerly in the Winchester seat.

Michael Mates, of Asil Nadir 'Don't Let the Buggers Get You Down' fame, has been MP here (previously Petersfield) since 1974. Big, burly, bushy-eye-browed and of military bearing, Lt. Colonel Mates was born in 1934, attended Blundell's School and (inconclusively) King's College, Cambridge and served in the Queen's Dragoon Guards for twenty years. Somewhat mired in allegations over links with arms companies while a member of the Defence Select Committee, as a One Nation Europhile, and leading the Heseltine (1990) and Clarke (1997) campaigns, he also angered Thatcherites by heading the poll-tax rebellion. He has to dream of a Clarke leadership as his only route to redemption.
 |
| Wealthy Achievers, Suburban Areas |
40.01% |
14.99% |
266.88 |
|
| Affluent Greys, Rural Communities |
2.08% |
2.13% |
97.94 |
|
| Prosperous Pensioners, Retirement Areas |
2.68% |
2.49% |
107.99 |
|
| Affluent Executives, Family Areas |
10.97% |
4.43% |
247.90 |
|
| Well-Off Workers, Family Areas |
11.04% |
7.27% |
151.73 |
|
| Affluent Urbanites, Town & City Areas |
1.21% |
2.56% |
47.08 |
|
| Prosperous Professionals, Metropolitan Areas |
0.65% |
2.04% |
32.02 |
|
| Better-Off Executives, Inner City Areas |
0.00% |
3.94% |
0.00 |
|
| Comfortable Middle Agers, Mature Home Owning Areas |
18.17% |
13.04% |
139.36 |
|
| Skilled Workers, Home Owning Areas |
2.32% |
12.70% |
18.25 |
|
| New Home Owners, Mature Communities |
3.71% |
8.14% |
45.60 |
|
| White Collar Workers, Better-Off Multi Ethnic Areas |
0.00% |
4.02% |
0.00 |
|
| Older People, Less Prosperous Areas |
1.34% |
3.19% |
42.02 |
|
| Council Estate Residents, Better-Off Homes |
5.14% |
11.31% |
45.46 |
|
| Council Estate Residents, High Unemployment |
0.48% |
3.06% |
15.51 |
|
| Council Estate Residents, Greatest Hardship |
0.18% |
2.52% |
7.09 |
|
| People in Multi-Ethnic, Low-Income Areas |
0.00% |
2.10% |
0.00 |
|
| Unclassified |
0.01% |
0.06% |
22.86 |
|
|
 |
|
|
| £0-5K |
5.52% |
9.41% |
58.60 |
|
| £5-10K |
11.84% |
16.63% |
71.19 |
|
| £10-15K |
14.01% |
16.58% |
84.51 |
|
| £15-20K |
13.10% |
13.58% |
96.47 |
|
| £20-25K |
11.09% |
10.39% |
106.71 |
|
| £25-30K |
8.97% |
7.77% |
115.37 |
|
| £30-35K |
7.11% |
5.79% |
122.72 |
|
| £35-40K |
5.59% |
4.33% |
128.98 |
|
| £40-45K |
4.39% |
3.27% |
134.37 |
|
| £45-50K |
3.45% |
2.48% |
139.05 |
|
| £50-55K |
2.73% |
1.90% |
143.15 |
|
| £55-60K |
2.16% |
1.47% |
146.79 |
|
| £60-65K |
1.73% |
1.15% |
150.04 |
|
| £65-70K |
1.39% |
0.91% |
152.97 |
|
| £70-75K |
1.12% |
0.72% |
155.64 |
|
| £75-80K |
0.91% |
0.57% |
158.08 |
|
| £80-85K |
0.74% |
0.46% |
160.34 |
|
| £85-90K |
0.61% |
0.37% |
162.43 |
|
| £90-95K |
0.50% |
0.31% |
164.39 |
|
| £95-100K |
0.42% |
0.25% |
166.22 |
|
| £100K + |
2.37% |
1.34% |
176.32 |
|
|
|
|


|
1992-1997
|
1997-2001
|
|
|
|
| Con |
-12.56% |
| Lab |
7.71% |
| LD |
0.61% |
|
| Con |
-0.42% |
| Lab |
2.51% |
| LD |
1.84% |
|
|
|
Michael Mates
Conservative hold
|
| Con |
 |
23,950 |
47.62% |
| Lab |
 |
9,866 |
19.62% |
| LD |
 |
15,060 |
29.95% |
| Oth |
 |
1,413 |
2.81% |
| Maj |
 |
8,890 |
17.68% |
| Turn |
|
50,289 |
63.82% |
|
|
|
Michael Mates
Conservative hold
|
| LD |
Robert Booker |
15,060 |
29.95% |
| L |
Barbara Burfoot |
9,866 |
19.62% |
| UK |
Stephen Coles |
1,413 |
2.81% |
| C |
Michael Mates |
23,950 |
47.62% |
|
Candidates representing 4 parties stood for election to this seat.
|
|
|
Michael Mates
Conservative
|
| Con |
|
27,927 |
48.04% |
| Lab |
|
9,945 |
17.11% |
| LD |
|
16,337 |
28.11% |
| Ref |
 |
2,757 |
4.74% |
| Oth |
|
1,162 |
2.00% |
| Maj |
|
11,590 |
19.94% |
| Turn |
|
58,128 |
75.88% |
|
|
|
|
Conservative
|
| Con |
|
35,960 |
60.60% |
| Lab |
|
5,605 |
9.40% |
| LD |
|
16,303 |
27.50% |
| Oth |
|
1,451 |
2.40% |
| Maj |
|
19,657 |
33.10% |
| Turn |
|
59,319 |
80.43% |
|
|
|
|
|