|
Hampshire North East
Conservative hold

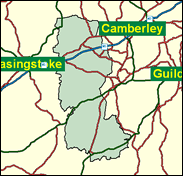
The northern part of the former East Hampshire division, a long strip down the edge of the county forms the very safe new Conservative seat of NE Hants; indeed its majority of 14,398 is only surpassed by six others in Britain, and this represents only a slight dent even in the disastrous year of 1997. The largest town is the fast growing and very affluent Fleet, just off the M3 motorway, but it also includes Liss, Liphook, Whitehill with its military presence and stretches to Eversley near the Berkshire border. With the continued growth of the desirable Fleet (and other) areas, this may be a serious contender for the largest majority of all Tory seats at the next general election.

James Arbuthnot, Tory Chief Whip, is a rightwing Chancery barrister and loss-making Lloyds underwriter who arrived here in 1997 from his dismantled Wanstead & Woodford seat where he had been MP since 1987. Though dry on economics, as a poll-tax abstainer he was happier under Major than Thatcher. The son of Sir John Arbuthnot, MP for Dover 1950-64, he was born 1952, educated at Eton and Trinity College, Cambridge, and given his dessicated manner and a monotonous voice which has been compared to a speaking clock, he is suited to the silent role of Chief Whip.
 |
| Wealthy Achievers, Suburban Areas |
53.24% |
14.99% |
355.06 |
|
| Affluent Greys, Rural Communities |
0.28% |
2.13% |
12.95 |
|
| Prosperous Pensioners, Retirement Areas |
1.49% |
2.49% |
60.10 |
|
| Affluent Executives, Family Areas |
16.66% |
4.43% |
376.41 |
|
| Well-Off Workers, Family Areas |
6.94% |
7.27% |
95.38 |
|
| Affluent Urbanites, Town & City Areas |
0.90% |
2.56% |
34.93 |
|
| Prosperous Professionals, Metropolitan Areas |
0.26% |
2.04% |
12.60 |
|
| Better-Off Executives, Inner City Areas |
0.06% |
3.94% |
1.44 |
|
| Comfortable Middle Agers, Mature Home Owning Areas |
12.14% |
13.04% |
93.12 |
|
| Skilled Workers, Home Owning Areas |
0.97% |
12.70% |
7.64 |
|
| New Home Owners, Mature Communities |
2.66% |
8.14% |
32.69 |
|
| White Collar Workers, Better-Off Multi Ethnic Areas |
0.02% |
4.02% |
0.43 |
|
| Older People, Less Prosperous Areas |
0.09% |
3.19% |
2.96 |
|
| Council Estate Residents, Better-Off Homes |
3.80% |
11.31% |
33.58 |
|
| Council Estate Residents, High Unemployment |
0.00% |
3.06% |
0.00 |
|
| Council Estate Residents, Greatest Hardship |
0.00% |
2.52% |
0.00 |
|
| People in Multi-Ethnic, Low-Income Areas |
0.00% |
2.10% |
0.00 |
|
| Unclassified |
0.51% |
0.06% |
813.54 |
|
|
 |
 |
 |
| £0-5K |
3.55% |
9.41% |
37.73 |
|
| £5-10K |
8.29% |
16.63% |
49.83 |
|
| £10-15K |
10.92% |
16.58% |
65.86 |
|
| £15-20K |
11.31% |
13.58% |
83.23 |
|
| £20-25K |
10.46% |
10.39% |
100.65 |
|
| £25-30K |
9.13% |
7.77% |
117.49 |
|
| £30-35K |
7.73% |
5.79% |
133.44 |
|
| £35-40K |
6.43% |
4.33% |
148.38 |
|
| £40-45K |
5.30% |
3.27% |
162.30 |
|
| £45-50K |
4.35% |
2.48% |
175.24 |
|
| £50-55K |
3.57% |
1.90% |
187.23 |
|
| £55-60K |
2.92% |
1.47% |
198.37 |
|
| £60-65K |
2.40% |
1.15% |
208.71 |
|
| £65-70K |
1.98% |
0.91% |
218.33 |
|
| £70-75K |
1.63% |
0.72% |
227.28 |
|
| £75-80K |
1.35% |
0.57% |
235.64 |
|
| £80-85K |
1.13% |
0.46% |
243.45 |
|
| £85-90K |
0.94% |
0.37% |
250.76 |
|
| £90-95K |
0.79% |
0.31% |
257.62 |
|
| £95-100K |
0.66% |
0.25% |
264.06 |
|
| £100K + |
3.99% |
1.34% |
297.13 |
|
|
|

|


|
1992-1997
|
1997-2001
|
|
|
|
| Con |
-13.10% |
| Lab |
6.85% |
| LD |
-2.37% |
|
| Con |
2.30% |
| Lab |
3.85% |
| LD |
0.30% |
|
|
 |
James Arbuthnot
Conservative hold
|
| Con |
 |
23,379 |
53.20% |
| Lab |
 |
8,744 |
19.90% |
| LD |
 |
10,122 |
23.03% |
| Oth |
 |
1,702 |
3.87% |
| Maj |
 |
13,257 |
30.17% |
| Turn |
 |
43,947 |
61.62% |
|
|
 |
James Arbuthnot
Conservative hold
|
| C |
James Arbuthnot |
23,379 |
53.20% |
| L |
Barry Jones |
8,744 |
19.90% |
| UK |
Graham Mellstrom |
1,702 |
3.87% |
| LD |
Mike Plummer |
10,122 |
23.03% |
|
Candidates representing 4 parties stood for election to this seat.
|
|
 |
James Arbuthnot
Conservative
|
| Con |
 |
26,017 |
50.90% |
| Lab |
 |
8,203 |
16.05% |
| LD |
 |
11,619 |
22.73% |
| Ref |
 |
2,420 |
4.73% |
| Oth |
 |
2,852 |
5.58% |
| Maj |
 |
14,398 |
28.17% |
| Turn |
 |
51,111 |
73.95% |
|
|
 |
|
Conservative
|
| Con |
 |
33,782 |
64.00% |
| Lab |
 |
4,854 |
9.20% |
| LD |
 |
13,242 |
25.10% |
| Oth |
 |
907 |
1.70% |
| Maj |
 |
20,540 |
38.90% |
| Turn |
 |
52,785 |
80.12% |
|
|
 |
|

|

