|
Hampshire North West
Labour gain

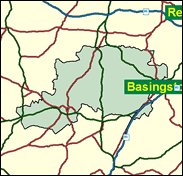
Yet another seat in Hampshire, the shire county which has the jointly highest number of constituencies (17, with Essex and Kent) and jointly the highest number of Tory seats (11, equal with Surrey). This is one of several safe Tory seats. The largest community by far is Andover, but it stretches over a large acreage to include literally hundreds of attractive villages. The Liberal Democrats were second in 1997, but they did not benefit from any tactical voting as their vote actually declined by four per cent. Labour's went up by a national average of 11 per cent, which effectively doubled their vote, with no practical reward.

Sir George Young, an immensely tall, bland, soft-spoken patrician Tory, migrated here (or chicken-ran, according to taste) from his adversely redrawn Ealing Acton seat in 1997, having been an MP there since 1974. The runner-up for Speaker in 2000, a very non-partisan figure and "dripping wet" (Lord Tebbit) who backed Heseltine in 1990, he was given the rather dirty job by Major of privatising the railways. As a sixth baronet, educated at Eton and Christ Church, Oxford, he worked unusually as an economist with NEDO and then with the post office before becoming an MP.
 |
| Wealthy Achievers, Suburban Areas |
33.55% |
14.99% |
223.74 |
|
| Affluent Greys, Rural Communities |
0.38% |
2.13% |
17.82 |
|
| Prosperous Pensioners, Retirement Areas |
0.17% |
2.49% |
6.98 |
|
| Affluent Executives, Family Areas |
9.75% |
4.43% |
220.23 |
|
| Well-Off Workers, Family Areas |
10.43% |
7.27% |
143.39 |
|
| Affluent Urbanites, Town & City Areas |
0.91% |
2.56% |
35.66 |
|
| Prosperous Professionals, Metropolitan Areas |
0.03% |
2.04% |
1.56 |
|
| Better-Off Executives, Inner City Areas |
0.04% |
3.94% |
0.94 |
|
| Comfortable Middle Agers, Mature Home Owning Areas |
17.42% |
13.04% |
133.58 |
|
| Skilled Workers, Home Owning Areas |
6.61% |
12.70% |
52.05 |
|
| New Home Owners, Mature Communities |
5.55% |
8.14% |
68.18 |
|
| White Collar Workers, Better-Off Multi Ethnic Areas |
0.22% |
4.02% |
5.36 |
|
| Older People, Less Prosperous Areas |
3.11% |
3.19% |
97.61 |
|
| Council Estate Residents, Better-Off Homes |
10.68% |
11.31% |
94.38 |
|
| Council Estate Residents, High Unemployment |
0.55% |
3.06% |
18.04 |
|
| Council Estate Residents, Greatest Hardship |
0.60% |
2.52% |
23.88 |
|
| People in Multi-Ethnic, Low-Income Areas |
0.00% |
2.10% |
0.00 |
|
| Unclassified |
0.01% |
0.06% |
14.40 |
|
|
 |
 |
 |
| £0-5K |
5.23% |
9.41% |
55.55 |
|
| £5-10K |
11.47% |
16.63% |
68.95 |
|
| £10-15K |
13.72% |
16.58% |
82.75 |
|
| £15-20K |
12.98% |
13.58% |
95.57 |
|
| £20-25K |
11.11% |
10.39% |
106.93 |
|
| £25-30K |
9.08% |
7.77% |
116.79 |
|
| £30-35K |
7.26% |
5.79% |
125.30 |
|
| £35-40K |
5.75% |
4.33% |
132.60 |
|
| £40-45K |
4.53% |
3.27% |
138.88 |
|
| £45-50K |
3.58% |
2.48% |
144.28 |
|
| £50-55K |
2.84% |
1.90% |
148.96 |
|
| £55-60K |
2.26% |
1.47% |
153.01 |
|
| £60-65K |
1.80% |
1.15% |
156.55 |
|
| £65-70K |
1.45% |
0.91% |
159.65 |
|
| £70-75K |
1.17% |
0.72% |
162.39 |
|
| £75-80K |
0.95% |
0.57% |
164.82 |
|
| £80-85K |
0.77% |
0.46% |
166.99 |
|
| £85-90K |
0.63% |
0.37% |
168.94 |
|
| £90-95K |
0.52% |
0.31% |
170.70 |
|
| £95-100K |
0.43% |
0.25% |
172.30 |
|
| £100K + |
2.43% |
1.34% |
180.43 |
|
|
|

|


|
1992-1997
|
1997-2001
|
|
|
|
| Con |
-12.86% |
| Lab |
11.00% |
| LD |
-3.89% |
|
| Con |
-19.81% |
| Lab |
26.52% |
| LD |
-2.87% |
|
|
 |
George Young
Labour gain
|
| Con |
 |
12,365 |
25.43% |
| Lab |
 |
24,374 |
50.12% |
| LD |
 |
10,329 |
21.24% |
| Oth |
 |
1,563 |
3.21% |
| Maj |
 |
12,009 |
24.69% |
| Turn |
 |
48,631 |
63.69% |
|
|
 |
George Young
Labour gain
|
| LD |
Alex Bentley |
10,329 |
21.24% |
| C |
Mick Mumford |
12,365 |
25.43% |
| UK |
Stanley Oram |
1,563 |
3.21% |
| L |
George Young |
24,374 |
50.12% |
|
Candidates representing 4 parties stood for election to this seat.
|
|
 |
George Young
Conservative
|
| Con |
 |
24,730 |
45.24% |
| Lab |
 |
12,900 |
23.60% |
| LD |
 |
13,179 |
24.11% |
| Ref |
 |
1,533 |
2.80% |
| Oth |
 |
2,325 |
4.25% |
| Maj |
 |
11,551 |
21.13% |
| Turn |
 |
54,667 |
74.66% |
|
|
 |
|
Conservative
|
| Con |
 |
33,154 |
58.10% |
| Lab |
 |
7,175 |
12.60% |
| LD |
 |
15,990 |
28.00% |
| Oth |
 |
768 |
1.30% |
| Maj |
 |
17,164 |
30.10% |
| Turn |
 |
57,087 |
80.51% |
|
|
 |
|

|

