|
Hampstead & Highgate
Labour hold

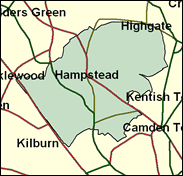
With more than 60 per cent of the voters employed in professional and managerial jobs, and nigh on 80 per cent in all middle class occupations, this seat on London's northern heights can only be described as a home of the elite; but it is clearly the intellectual and public sector elite (though they can't all be actors or authors); the Labour majority enjoyed by Oscar-winner Glenda Jackson surpassed 13,000 or 30 per cent in the 1997 election, taking this way out of the marginal zone. It should be remembered that the seat was only gained by Labour in 1992, for the first time since their 1966 landslide, so there is obviously a very strong long term tide flowing against the Conservatives in "Ham and High". Put simply, they are massively unfashionable. Nor should the substantial Irish, non-white and private rented flat neighbourhoods down the hill in West and South Hampstead towards Kilburn be ignored. This is looking more and more like the classic New Labour territory of the turn of the century.

Glenda Jackson, drawn into politics as an alternative to unsure prospects as a rising-60 year-old actress who did not want to be typecast as the nurse in Romeo and Juliet, won this seat from the Conservatives in 1992, and became a Transport Minister for 2 years in 1997 until dropped in 1999. A bricklayer's daughter, born 1936, and educated at West Kirby County Grammar School for Girls and RADA, as a transport minister she conveyed a rather humourless image if without actressy vapourings. The official explanation of her being dropped, to run for London Mayor, held little water.
 |
| Wealthy Achievers, Suburban Areas |
0.66% |
14.99% |
4.40 |
|
| Affluent Greys, Rural Communities |
0.00% |
2.13% |
0.00 |
|
| Prosperous Pensioners, Retirement Areas |
1.32% |
2.49% |
53.15 |
|
| Affluent Executives, Family Areas |
0.00% |
4.43% |
0.00 |
|
| Well-Off Workers, Family Areas |
0.00% |
7.27% |
0.01 |
|
| Affluent Urbanites, Town & City Areas |
16.26% |
2.56% |
633.83 |
|
| Prosperous Professionals, Metropolitan Areas |
10.19% |
2.04% |
499.04 |
|
| Better-Off Executives, Inner City Areas |
51.31% |
3.94% |
1,300.97 |
|
| Comfortable Middle Agers, Mature Home Owning Areas |
0.00% |
13.04% |
0.00 |
|
| Skilled Workers, Home Owning Areas |
0.00% |
12.70% |
0.00 |
|
| New Home Owners, Mature Communities |
0.00% |
8.14% |
0.00 |
|
| White Collar Workers, Better-Off Multi Ethnic Areas |
2.37% |
4.02% |
59.01 |
|
| Older People, Less Prosperous Areas |
0.00% |
3.19% |
0.00 |
|
| Council Estate Residents, Better-Off Homes |
0.00% |
11.31% |
0.00 |
|
| Council Estate Residents, High Unemployment |
9.88% |
3.06% |
322.64 |
|
| Council Estate Residents, Greatest Hardship |
0.00% |
2.52% |
0.00 |
|
| People in Multi-Ethnic, Low-Income Areas |
7.99% |
2.10% |
380.52 |
|
| Unclassified |
0.03% |
0.06% |
44.05 |
|
|
 |
 |
 |
| £0-5K |
4.21% |
9.41% |
44.73 |
|
| £5-10K |
8.38% |
16.63% |
50.38 |
|
| £10-15K |
10.34% |
16.58% |
62.39 |
|
| £15-20K |
10.49% |
13.58% |
77.25 |
|
| £20-25K |
9.73% |
10.39% |
93.67 |
|
| £25-30K |
8.62% |
7.77% |
110.89 |
|
| £30-35K |
7.44% |
5.79% |
128.44 |
|
| £35-40K |
6.33% |
4.33% |
146.00 |
|
| £40-45K |
5.33% |
3.27% |
163.35 |
|
| £45-50K |
4.48% |
2.48% |
180.34 |
|
| £50-55K |
3.75% |
1.90% |
196.90 |
|
| £55-60K |
3.14% |
1.47% |
212.96 |
|
| £60-65K |
2.63% |
1.15% |
228.50 |
|
| £65-70K |
2.21% |
0.91% |
243.50 |
|
| £70-75K |
1.86% |
0.72% |
257.97 |
|
| £75-80K |
1.56% |
0.57% |
271.93 |
|
| £80-85K |
1.32% |
0.46% |
285.37 |
|
| £85-90K |
1.12% |
0.37% |
298.33 |
|
| £90-95K |
0.95% |
0.31% |
310.81 |
|
| £95-100K |
0.81% |
0.25% |
322.84 |
|
| £100K + |
5.27% |
1.34% |
392.24 |
|
|
|

|


|
1992-1997
|
1997-2001
|
|
|
|
| Con |
-13.57% |
| Lab |
11.20% |
| LD |
1.45% |
|
| Con |
-2.59% |
| Lab |
-10.52% |
| LD |
8.09% |
|
|
 |
Glenda Jackson
Labour hold
|
| Con |
 |
8,725 |
24.64% |
| Lab |
 |
16,601 |
46.89% |
| LD |
 |
7,273 |
20.54% |
| Oth |
 |
2,808 |
7.93% |
| Maj |
 |
7,876 |
22.24% |
| Turn |
 |
35,407 |
54.21% |
|
|
 |
Glenda Jackson
Labour hold
|
| SA |
Helen Cooper |
559 |
1.58% |
| G |
Andrew Cornwell |
1,654 |
4.67% |
| L |
Glenda Jackson |
16,601 |
46.89% |
| IK |
Amos Klein |
43 |
0.12% |
| UK |
Thomas McDermott |
316 |
0.89% |
| C |
Andrew Mennear |
8,725 |
24.64% |
| LD |
Johnathan Simpson |
7,273 |
20.54% |
| P |
Mary Teale |
92 |
0.26% |
| IX |
Sister XNunoftheabove |
144 |
0.41% |
|
Candidates representing 9 parties stood for election to this seat.
|
|
 |
Glenda Jackson
Labour
|
| Con |
 |
11,991 |
27.23% |
| Lab |
 |
25,275 |
57.40% |
| LD |
 |
5,481 |
12.45% |
| Ref |
 |
667 |
1.51% |
| Oth |
 |
617 |
1.40% |
| Maj |
 |
13,284 |
30.17% |
| Turn |
 |
44,031 |
67.86% |
|
|
 |
|
Labour
|
| Con |
 |
18,582 |
40.80% |
| Lab |
 |
21,059 |
46.20% |
| LD |
 |
5,028 |
11.00% |
| Oth |
 |
900 |
2.00% |
| Maj |
 |
2,477 |
5.40% |
| Turn |
 |
45,569 |
72.38% |
|
|
 |
|

|

