|
Harborough
Conservative hold

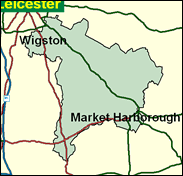
Leicester, like Nottingham, is actually a larger conurbation than the Census population figures at first sight indicate. There are very substantial parts of the built-up area which are outside the city boundaries and placed in seats without the name Leicester in the title. Perhaps the most notable of these is Harborough, which includes the substantial communities of Wigston and Oadby to the south and south east of the city. Oadby is extremely middle class and owner-occupied, Wigston a little more mixed. Their political preferences are far removed from those of the three safe Labour seats in Leicester, with a Conservative predominance and a Liberal Democrat presence. With the addition of the south eastern section of the countryside of the county, including the town of Market Harborough after which the seat is somewhat misleadingly titled, Labour can do no better than third, although they advanced by 13 per cent in 1997 to run the LDs very close for second place, letting Edward Garnier, who must have been worried about tactical voting, through fairly easily with a 42 per cent share.

Edward Garnier, a QC specialising in libel, elected here in 1992, is Shadow Attorney General. His vote for Clarke in 1997 underlined his strong support for the Maastricht Treaty and so his detachment from the Eurosceptic orthodoxy. Born 1952 into an army family, and self-described as "on the left wing of the party on social affairs" but "rather more rightwing on economics", he is drawn from a grander Tory tradition as the grandson of the 8th Baron Walsingham, and was educated at Wellington and Jesus College, Oxford. He has all the clipped mannerisms of the political lawyer.
 |
| Wealthy Achievers, Suburban Areas |
25.24% |
14.99% |
168.35 |
|
| Affluent Greys, Rural Communities |
0.34% |
2.13% |
15.89 |
|
| Prosperous Pensioners, Retirement Areas |
1.79% |
2.49% |
72.10 |
|
| Affluent Executives, Family Areas |
9.26% |
4.43% |
209.36 |
|
| Well-Off Workers, Family Areas |
19.82% |
7.27% |
272.47 |
|
| Affluent Urbanites, Town & City Areas |
0.13% |
2.56% |
4.97 |
|
| Prosperous Professionals, Metropolitan Areas |
0.40% |
2.04% |
19.72 |
|
| Better-Off Executives, Inner City Areas |
0.00% |
3.94% |
0.00 |
|
| Comfortable Middle Agers, Mature Home Owning Areas |
17.35% |
13.04% |
133.05 |
|
| Skilled Workers, Home Owning Areas |
14.94% |
12.70% |
117.63 |
|
| New Home Owners, Mature Communities |
5.68% |
8.14% |
69.79 |
|
| White Collar Workers, Better-Off Multi Ethnic Areas |
0.04% |
4.02% |
0.91 |
|
| Older People, Less Prosperous Areas |
3.04% |
3.19% |
95.57 |
|
| Council Estate Residents, Better-Off Homes |
1.19% |
11.31% |
10.51 |
|
| Council Estate Residents, High Unemployment |
0.77% |
3.06% |
25.23 |
|
| Council Estate Residents, Greatest Hardship |
0.00% |
2.52% |
0.00 |
|
| People in Multi-Ethnic, Low-Income Areas |
0.00% |
2.10% |
0.00 |
|
| Unclassified |
0.00% |
0.06% |
0.00 |
|
|
 |
 |
 |
| £0-5K |
7.41% |
9.41% |
78.70 |
|
| £5-10K |
14.90% |
16.63% |
89.58 |
|
| £10-15K |
16.26% |
16.58% |
98.10 |
|
| £15-20K |
14.10% |
13.58% |
103.80 |
|
| £20-25K |
11.15% |
10.39% |
107.25 |
|
| £25-30K |
8.48% |
7.77% |
109.09 |
|
| £30-35K |
6.36% |
5.79% |
109.87 |
|
| £35-40K |
4.76% |
4.33% |
109.95 |
|
| £40-45K |
3.58% |
3.27% |
109.59 |
|
| £45-50K |
2.70% |
2.48% |
108.97 |
|
| £50-55K |
2.06% |
1.90% |
108.20 |
|
| £55-60K |
1.58% |
1.47% |
107.35 |
|
| £60-65K |
1.23% |
1.15% |
106.48 |
|
| £65-70K |
0.96% |
0.91% |
105.62 |
|
| £70-75K |
0.75% |
0.72% |
104.78 |
|
| £75-80K |
0.60% |
0.57% |
103.97 |
|
| £80-85K |
0.48% |
0.46% |
103.21 |
|
| £85-90K |
0.38% |
0.37% |
102.49 |
|
| £90-95K |
0.31% |
0.31% |
101.82 |
|
| £95-100K |
0.25% |
0.25% |
101.18 |
|
| £100K + |
1.32% |
1.34% |
98.00 |
|
|
|

|


|
1992-1997
|
1997-2001
|
|
|
|
| Con |
-10.88% |
| Lab |
12.85% |
| LD |
-4.88% |
|
| Con |
2.86% |
| Lab |
-5.18% |
| LD |
3.86% |
|
|
 |
Edward Garnier
Conservative hold
|
| Con |
 |
20,748 |
44.69% |
| Lab |
 |
9,271 |
19.97% |
| LD |
 |
15,496 |
33.38% |
| Oth |
 |
912 |
1.96% |
| Maj |
 |
5,252 |
11.31% |
| Turn |
 |
46,427 |
63.34% |
|
|
 |
Edward Garnier
Conservative hold
|
| C |
Edward Garnier |
20,748 |
44.69% |
| LD |
Jill Hope |
15,496 |
33.38% |
| L |
Raj Jethwa |
9,271 |
19.97% |
| UK |
David Knight |
912 |
1.96% |
|
Candidates representing 4 parties stood for election to this seat.
|
|
 |
Edward Garnier
Conservative
|
| Con |
 |
22,170 |
41.82% |
| Lab |
 |
13,332 |
25.15% |
| LD |
 |
15,646 |
29.52% |
| Ref |
 |
1,859 |
3.51% |
| Oth |
|
0 |
0.00% |
| Maj |
 |
6,524 |
12.31% |
| Turn |
 |
53,007 |
75.27% |
|
|
 |
|
Conservative
|
| Con |
 |
29,274 |
52.70% |
| Lab |
 |
6,828 |
12.30% |
| LD |
 |
19,122 |
34.40% |
| Oth |
 |
290 |
0.50% |
| Maj |
 |
10,152 |
18.30% |
| Turn |
 |
55,514 |
81.49% |
|
|
 |
|

|

