|
Aberdeen North
Labour hold

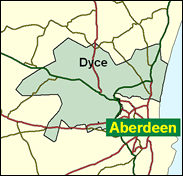
Aberdeen's representation at Westminster was increased from two seats to three in the boundary changes that came into force in 1997. This involved bringing in extra voters previously in other constituencies, in the case of Aberdeen North from the private housing estates around Bridge of Don and Dyce which had burgeoned as a result of the oil boom a couple of decades ago. These were in Malcolm Bruce's Liberal Democrat Gordon seat, and generally less solidly and ancestrally Labour than the massive council estates such as Northfield and Mastrick typical of the old North. Like many other urban seats in Scotland, Aberdeen North showed a potential vulnerability to the Nationalists in the inaugural Scottish Parliament elections of May 1999, Labour polling only 37pc compared with 48pc in the General election two years before. The SNP were just 398 votes behind, only one per cent, on a lower than average 51pc turnout. However, it is very possible that the SNP will not do as well as in the forthcoming Westminster elections, to which they may not devote as much energy, and for which their representation may not seem quite so appropriate to the electors choosing a government for the whole of the United Kingdom.

Malcolm Savidge is in the exposed position of being one of five English-born Labour MPs in Scottish seats, potentially vulnerable to any post-devolution upsurge of Anglophobia stoked up by the SNP, especially after the very tight result in this seat in the Scottish Parliament election in 1999. Claiming descent from a medieval Commons Speaker, he was born in Surrey in 1946, attended Wallington County Grammar School for Boys and Aberdeen University, and spent 24 years as a Maths teacher in Aberdeen schools. A bespectacled, broad-grinning Blairite loyalist unkindly dubbed ìone of the government's loyal nonentities' as the bowler of soft Prime Ministerial questions, he strongly backed the government on Iraq, Kosovo and Sierra Leone, but broke ranks to call for direct election of the Lords by PR.

 |
| Wealthy Achievers, Suburban Areas |
3.97% |
14.99% |
26.49 |
|
| Affluent Greys, Rural Communities |
0.00% |
2.13% |
0.00 |
|
| Prosperous Pensioners, Retirement Areas |
0.15% |
2.49% |
6.11 |
|
| Affluent Executives, Family Areas |
12.26% |
4.43% |
276.99 |
|
| Well-Off Workers, Family Areas |
14.27% |
7.27% |
196.15 |
|
| Affluent Urbanites, Town & City Areas |
3.87% |
2.56% |
150.90 |
|
| Prosperous Professionals, Metropolitan Areas |
0.00% |
2.04% |
0.00 |
|
| Better-Off Executives, Inner City Areas |
0.68% |
3.94% |
17.37 |
|
| Comfortable Middle Agers, Mature Home Owning Areas |
4.33% |
13.04% |
33.23 |
|
| Skilled Workers, Home Owning Areas |
4.51% |
12.70% |
35.50 |
|
| New Home Owners, Mature Communities |
10.98% |
8.14% |
134.89 |
|
| White Collar Workers, Better-Off Multi Ethnic Areas |
0.15% |
4.02% |
3.85 |
|
| Older People, Less Prosperous Areas |
3.84% |
3.19% |
120.45 |
|
| Council Estate Residents, Better-Off Homes |
30.19% |
11.31% |
266.92 |
|
| Council Estate Residents, High Unemployment |
4.56% |
3.06% |
149.06 |
|
| Council Estate Residents, Greatest Hardship |
6.22% |
2.52% |
247.11 |
|
| People in Multi-Ethnic, Low-Income Areas |
0.00% |
2.10% |
0.00 |
|
| Unclassified |
0.00% |
0.06% |
0.00 |
|
|
 |
 |
 |
| £0-5K |
8.42% |
9.41% |
89.39 |
|
| £5-10K |
15.89% |
16.63% |
95.56 |
|
| £10-15K |
16.50% |
16.58% |
99.54 |
|
| £15-20K |
13.92% |
13.58% |
102.50 |
|
| £20-25K |
10.87% |
10.39% |
104.59 |
|
| £25-30K |
8.23% |
7.77% |
105.89 |
|
| £30-35K |
6.17% |
5.79% |
106.52 |
|
| £35-40K |
4.62% |
4.33% |
106.59 |
|
| £40-45K |
3.47% |
3.27% |
106.23 |
|
| £45-50K |
2.62% |
2.48% |
105.52 |
|
| £50-55K |
1.99% |
1.90% |
104.56 |
|
| £55-60K |
1.52% |
1.47% |
103.40 |
|
| £60-65K |
1.18% |
1.15% |
102.10 |
|
| £65-70K |
0.91% |
0.91% |
100.70 |
|
| £70-75K |
0.71% |
0.72% |
99.24 |
|
| £75-80K |
0.56% |
0.57% |
97.73 |
|
| £80-85K |
0.44% |
0.46% |
96.20 |
|
| £85-90K |
0.35% |
0.37% |
94.65 |
|
| £90-95K |
0.28% |
0.31% |
93.11 |
|
| £95-100K |
0.23% |
0.25% |
91.57 |
|
| £100K + |
1.10% |
1.34% |
81.48 |
|
|
|

|


|
1992-1997
|
1997-2001
|
|
|
|
| Con |
-3.60% |
| Lab |
12.77% |
| LD |
-9.69% |
| SNP |
-0.69% |
|
| Con |
-4.96% |
| Lab |
-4.53% |
| LD |
2.33% |
| SNP |
6.87% |
|
|
 |
Malcolm Savidge
Labour hold
|
| Con |
 |
3,047 |
10.04% |
| Lab |
 |
13,157 |
43.34% |
| LD |
 |
4,991 |
16.44% |
| SNP |
 |
8,708 |
28.69% |
| Oth |
 |
454 |
1.50% |
| Maj |
 |
4,449 |
14.66% |
| Turn |
 |
30,357 |
100.00% |
|
|
 |
Malcolm Savidge
Labour hold
|
| SNP |
Alasdair Allan |
8,708 |
28.69% |
| C |
Richard Cowling |
3,047 |
10.04% |
| LD |
Jim Donaldson |
4,991 |
16.44% |
| SSP |
Shona Forman |
454 |
1.50% |
| L |
Malcolm Savidge |
13,157 |
43.34% |
|
Candidates representing 5 parties stood for election to this seat.
|
|
 |
Malcolm Savidge
Labour
|
| Con |
 |
5,763 |
15.00% |
| Lab |
 |
18,389 |
47.87% |
| LD |
 |
5,421 |
14.11% |
| SNP |
 |
8,379 |
21.81% |
| Ref |
 |
463 |
1.21% |
| Oth |
|
0 |
0.00% |
| Maj |
 |
10,010 |
26.06% |
| Turn |
 |
38,415 |
70.74% |
|
|
 |
|
Labour
|
| Con |
 |
7,002 |
18.60% |
| Lab |
 |
13,189 |
35.10% |
| LD |
 |
8,952 |
23.80% |
| SNP |
 |
8,443 |
22.50% |
| Oth |
|
0 |
0.00% |
| Maj |
 |
4,237 |
11.30% |
| Turn |
 |
37,586 |
69.68% |
|
|
 |
|

|

