|
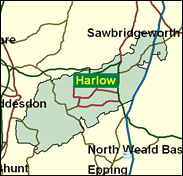
Harlow
Labour hold

One of more than 20 constituencies gained by Labour with a majority of more than 10,000 in 1997, like so many of that group it is very hard to see the Conservatives coming back, especially in a north west Essex new town seat which has always looked as if it should be Labour territory, even during the 14 year tenure of the eccentric Conservative Jerry Hayes from 1983 onwards. Yet the battle may not be over; the Conservative candidates in the local elections matched their Labour opponents closely in May 2000. Seeing as Labour has usually run well ahead at local level of their national performance in Harlow and similar seats in the South East of England, this may be ominous for Bill Rammell, but it is more likely that it reflected something of a midterm dip for his party, from which they have now recovered.

Bill Rammell, Labour's estuarially brogued MP here since 1997, is an on-message loyalist, born 1959, educated at Burnt Mill Comprehensive, Harlow, and Cardiff University, and who worked primarily as a students' union manager at London University. He allowed himself the indulgence of one discordant bash in 1997 - rebelling over lone parent benefit cuts, but, as Labour's replacement for the evangelical Europhile Giles Radice, his next dissent is likely to come over any foot-dragging on UK accession to the common currency.
 |
| Wealthy Achievers, Suburban Areas |
7.94% |
14.99% |
52.96 |
|
| Affluent Greys, Rural Communities |
0.00% |
2.13% |
0.00 |
|
| Prosperous Pensioners, Retirement Areas |
0.11% |
2.49% |
4.23 |
|
| Affluent Executives, Family Areas |
1.51% |
4.43% |
34.19 |
|
| Well-Off Workers, Family Areas |
5.93% |
7.27% |
81.49 |
|
| Affluent Urbanites, Town & City Areas |
2.02% |
2.56% |
78.65 |
|
| Prosperous Professionals, Metropolitan Areas |
0.00% |
2.04% |
0.00 |
|
| Better-Off Executives, Inner City Areas |
0.43% |
3.94% |
10.89 |
|
| Comfortable Middle Agers, Mature Home Owning Areas |
8.50% |
13.04% |
65.23 |
|
| Skilled Workers, Home Owning Areas |
11.52% |
12.70% |
90.72 |
|
| New Home Owners, Mature Communities |
15.29% |
8.14% |
187.71 |
|
| White Collar Workers, Better-Off Multi Ethnic Areas |
0.70% |
4.02% |
17.33 |
|
| Older People, Less Prosperous Areas |
9.12% |
3.19% |
286.15 |
|
| Council Estate Residents, Better-Off Homes |
35.99% |
11.31% |
318.21 |
|
| Council Estate Residents, High Unemployment |
0.66% |
3.06% |
21.52 |
|
| Council Estate Residents, Greatest Hardship |
0.29% |
2.52% |
11.51 |
|
| People in Multi-Ethnic, Low-Income Areas |
0.00% |
2.10% |
0.00 |
|
| Unclassified |
0.00% |
0.06% |
0.00 |
|
|
 |
 |
 |
| £0-5K |
8.64% |
9.41% |
91.77 |
|
| £5-10K |
15.20% |
16.63% |
91.39 |
|
| £10-15K |
15.77% |
16.58% |
95.15 |
|
| £15-20K |
13.47% |
13.58% |
99.14 |
|
| £20-25K |
10.66% |
10.39% |
102.53 |
|
| £25-30K |
8.18% |
7.77% |
105.17 |
|
| £30-35K |
6.20% |
5.79% |
107.12 |
|
| £35-40K |
4.70% |
4.33% |
108.47 |
|
| £40-45K |
3.57% |
3.27% |
109.35 |
|
| £45-50K |
2.73% |
2.48% |
109.85 |
|
| £50-55K |
2.10% |
1.90% |
110.05 |
|
| £55-60K |
1.62% |
1.47% |
110.02 |
|
| £60-65K |
1.26% |
1.15% |
109.81 |
|
| £65-70K |
0.99% |
0.91% |
109.47 |
|
| £70-75K |
0.78% |
0.72% |
109.04 |
|
| £75-80K |
0.62% |
0.57% |
108.52 |
|
| £80-85K |
0.50% |
0.46% |
107.96 |
|
| £85-90K |
0.40% |
0.37% |
107.36 |
|
| £90-95K |
0.33% |
0.31% |
106.73 |
|
| £95-100K |
0.27% |
0.25% |
106.09 |
|
| £100K + |
1.37% |
1.34% |
101.71 |
|
|
|

|


|
1992-1997
|
1997-2001
|
|
|
|
| Con |
-13.90% |
| Lab |
11.29% |
| LD |
-1.74% |
|
| Con |
2.65% |
| Lab |
-6.30% |
| LD |
3.95% |
|
|
 |
Bill Rammell
Labour hold
|
| Con |
 |
13,941 |
34.75% |
| Lab |
 |
19,169 |
47.79% |
| LD |
 |
5,381 |
13.41% |
| Oth |
 |
1,624 |
4.05% |
| Maj |
 |
5,228 |
13.03% |
| Turn |
 |
40,115 |
59.81% |
|
|
 |
Bill Rammell
Labour hold
|
| UK |
Tony Bennett |
1,223 |
3.05% |
| C |
Robert Halfon |
13,941 |
34.75% |
| SA |
John Hobbs |
401 |
1.00% |
| L |
Bill Rammell |
19,169 |
47.79% |
| LD |
Lorna Spenceley |
5,381 |
13.41% |
|
Candidates representing 5 parties stood for election to this seat.
|
|
 |
Bill Ramell
Labour gain
|
| Con |
 |
15,347 |
32.10% |
| Lab |
 |
25,861 |
54.09% |
| LD |
 |
4,523 |
9.46% |
| Ref |
 |
1,422 |
2.97% |
| Oth |
 |
659 |
1.38% |
| Maj |
 |
10,514 |
21.99% |
| Turn |
 |
47,812 |
74.62% |
|
|
 |
|
Conservative
|
| Con |
 |
24,568 |
46.00% |
| Lab |
 |
22,881 |
42.80% |
| LD |
 |
6,002 |
11.20% |
| Oth |
|
0 |
0.00% |
| Maj |
 |
1,687 |
3.20% |
| Turn |
 |
53,451 |
82.23% |
|
|
 |
|

|

