|
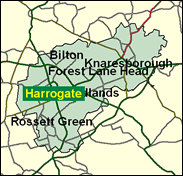
Harrogate & Knaresborough
Liberal Democrat hold

Norman Lamont's bid to move his parliamentary base to Harrogate in 1997 failed miserably against the local Liberal Democrat stalwart Phil Willis, and a more local candidate is unlikely to do much better. Harrogate showed in 1997 that a large northern spa town can show itself every bit as sympathetic to the Liberal Democrats in a general election as its south western counterparts Bath and Cheltenham, and Phil Willis will hope for as long as tenure as Don Foster and Nigel Jones. Liberal Democrat efforts will die hard here.

Phil Willis, a white-haired, black-bushy-eye-browed school teacher of Irish descent, won here for the Liberal Democrats in 1997, by ending the Commons' career of Norman Lamont. Typecast as the Party's education spokesman, he can sound like a fairly routine NUT activist on abolishing grammar schools, disliking Chris Woodhead, and in opposing Tory plans for opted-out schools. A policeman's son, born 1941, he was educated at Burnley Grammar School, City of Leeds and Carnegie College, and Birmingham University, and spent 35 years at the chalk face. He opposes revision of the Commons oath for the benefit of Sinn Fein's MPs, and calls for the 30pc 'No' minority in Northern Ireland not to be forgotten.
 |
| Wealthy Achievers, Suburban Areas |
26.26% |
14.99% |
175.18 |
|
| Affluent Greys, Rural Communities |
0.00% |
2.13% |
0.00 |
|
| Prosperous Pensioners, Retirement Areas |
4.52% |
2.49% |
181.65 |
|
| Affluent Executives, Family Areas |
4.37% |
4.43% |
98.67 |
|
| Well-Off Workers, Family Areas |
4.64% |
7.27% |
63.80 |
|
| Affluent Urbanites, Town & City Areas |
6.40% |
2.56% |
249.40 |
|
| Prosperous Professionals, Metropolitan Areas |
0.56% |
2.04% |
27.29 |
|
| Better-Off Executives, Inner City Areas |
4.96% |
3.94% |
125.85 |
|
| Comfortable Middle Agers, Mature Home Owning Areas |
19.73% |
13.04% |
151.28 |
|
| Skilled Workers, Home Owning Areas |
10.71% |
12.70% |
84.29 |
|
| New Home Owners, Mature Communities |
5.28% |
8.14% |
64.84 |
|
| White Collar Workers, Better-Off Multi Ethnic Areas |
5.93% |
4.02% |
147.44 |
|
| Older People, Less Prosperous Areas |
0.70% |
3.19% |
21.84 |
|
| Council Estate Residents, Better-Off Homes |
3.65% |
11.31% |
32.31 |
|
| Council Estate Residents, High Unemployment |
1.59% |
3.06% |
51.87 |
|
| Council Estate Residents, Greatest Hardship |
0.68% |
2.52% |
26.83 |
|
| People in Multi-Ethnic, Low-Income Areas |
0.00% |
2.10% |
0.00 |
|
| Unclassified |
0.04% |
0.06% |
61.80 |
|
|
 |
 |
 |
| £0-5K |
6.90% |
9.41% |
73.25 |
|
| £5-10K |
13.83% |
16.63% |
83.14 |
|
| £10-15K |
15.45% |
16.58% |
93.16 |
|
| £15-20K |
13.77% |
13.58% |
101.38 |
|
| £20-25K |
11.19% |
10.39% |
107.62 |
|
| £25-30K |
8.72% |
7.77% |
112.18 |
|
| £30-35K |
6.68% |
5.79% |
115.40 |
|
| £35-40K |
5.09% |
4.33% |
117.58 |
|
| £40-45K |
3.88% |
3.27% |
118.96 |
|
| £45-50K |
2.97% |
2.48% |
119.74 |
|
| £50-55K |
2.29% |
1.90% |
120.07 |
|
| £55-60K |
1.77% |
1.47% |
120.04 |
|
| £60-65K |
1.38% |
1.15% |
119.74 |
|
| £65-70K |
1.08% |
0.91% |
119.25 |
|
| £70-75K |
0.85% |
0.72% |
118.60 |
|
| £75-80K |
0.68% |
0.57% |
117.83 |
|
| £80-85K |
0.54% |
0.46% |
116.97 |
|
| £85-90K |
0.43% |
0.37% |
116.05 |
|
| £90-95K |
0.35% |
0.31% |
115.08 |
|
| £95-100K |
0.29% |
0.25% |
114.07 |
|
| £100K + |
1.43% |
1.34% |
106.64 |
|
|
|

|


|
1992-1997
|
1997-2001
|
|
|
|
| Con |
-13.35% |
| Lab |
-4.77% |
| LD |
18.14% |
|
| Con |
-31.10% |
| Lab |
25.89% |
| LD |
4.05% |
|
|
 |
Phil Willis
Liberal Democrat hold
|
| Con |
 |
3,101 |
7.35% |
| Lab |
 |
14,600 |
34.61% |
| LD |
 |
23,445 |
55.58% |
| Oth |
 |
1,033 |
2.45% |
| Maj |
 |
8,845 |
20.97% |
| Turn |
 |
42,179 |
64.71% |
|
|
 |
Phil Willis
Liberal Democrat hold
|
| UK |
Bill Brown |
761 |
1.80% |
| P |
John Cornforth |
272 |
0.64% |
| L |
Andrew Jones |
14,600 |
34.61% |
| C |
Alastair MacDonald |
3,101 |
7.35% |
| LD |
Phil Willis |
23,445 |
55.58% |
|
Candidates representing 5 parties stood for election to this seat.
|
|
 |
Phil Willis
Liberal Democrat gain
|
| Con |
 |
18,322 |
38.45% |
| Lab |
 |
4,159 |
8.73% |
| LD |
 |
24,558 |
51.54% |
| Ref |
|
0 |
0.00% |
| Oth |
 |
614 |
1.29% |
| Maj |
 |
6,236 |
13.09% |
| Turn |
 |
47,653 |
73.14% |
|
|
 |
|
Conservative
|
| Con |
 |
25,909 |
51.80% |
| Lab |
 |
6,777 |
13.50% |
| LD |
 |
16,698 |
33.40% |
| Oth |
 |
658 |
1.30% |
| Maj |
 |
9,211 |
18.40% |
| Turn |
 |
50,042 |
76.68% |
|
|
 |
|

|

