|
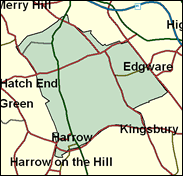
Harrow East
Labour hold

The European Union is less of a dirty phrase in London than elsewhere, such as the south coast and the West Country, but it was still an achievement in June 1999 for the Labour list of candidates to get most votes in Harrow East, which had been held by a Tory in Parliament as late as 1997, and some harbinger of another win for Tony McNulty here in the outer north west of the capital.

Tony McNulty, elected for Labour here in 1997, is a local man. A Harrow councillor (and briefly Council leader) and lecturer at the University of North London, born 1958 of Kilburn Irish parents, he was educated at Salvatorian (RC) College, Wealdstone, Stanmore Sixth Form College, and Liverpool and Virginia State Universities. His loyalism was reflected in his appointment as a PPS in 1997 and Assistant Whip in 1999.
 |
| Wealthy Achievers, Suburban Areas |
17.12% |
14.99% |
114.17 |
|
| Affluent Greys, Rural Communities |
0.00% |
2.13% |
0.00 |
|
| Prosperous Pensioners, Retirement Areas |
3.21% |
2.49% |
129.31 |
|
| Affluent Executives, Family Areas |
0.88% |
4.43% |
19.85 |
|
| Well-Off Workers, Family Areas |
0.23% |
7.27% |
3.22 |
|
| Affluent Urbanites, Town & City Areas |
4.58% |
2.56% |
178.67 |
|
| Prosperous Professionals, Metropolitan Areas |
7.06% |
2.04% |
345.87 |
|
| Better-Off Executives, Inner City Areas |
0.90% |
3.94% |
22.72 |
|
| Comfortable Middle Agers, Mature Home Owning Areas |
7.91% |
13.04% |
60.68 |
|
| Skilled Workers, Home Owning Areas |
1.25% |
12.70% |
9.81 |
|
| New Home Owners, Mature Communities |
2.07% |
8.14% |
25.42 |
|
| White Collar Workers, Better-Off Multi Ethnic Areas |
48.61% |
4.02% |
1,208.72 |
|
| Older People, Less Prosperous Areas |
1.12% |
3.19% |
35.15 |
|
| Council Estate Residents, Better-Off Homes |
2.57% |
11.31% |
22.76 |
|
| Council Estate Residents, High Unemployment |
0.90% |
3.06% |
29.23 |
|
| Council Estate Residents, Greatest Hardship |
0.01% |
2.52% |
0.46 |
|
| People in Multi-Ethnic, Low-Income Areas |
1.58% |
2.10% |
75.09 |
|
| Unclassified |
0.00% |
0.06% |
0.00 |
|
|
 |
 |
 |
| £0-5K |
4.95% |
9.41% |
52.62 |
|
| £5-10K |
10.49% |
16.63% |
63.07 |
|
| £10-15K |
12.77% |
16.58% |
77.01 |
|
| £15-20K |
12.41% |
13.58% |
91.39 |
|
| £20-25K |
10.92% |
10.39% |
105.08 |
|
| £25-30K |
9.14% |
7.77% |
117.63 |
|
| £30-35K |
7.47% |
5.79% |
128.91 |
|
| £35-40K |
6.02% |
4.33% |
138.95 |
|
| £40-45K |
4.83% |
3.27% |
147.84 |
|
| £45-50K |
3.86% |
2.48% |
155.68 |
|
| £50-55K |
3.10% |
1.90% |
162.60 |
|
| £55-60K |
2.49% |
1.47% |
168.72 |
|
| £60-65K |
2.00% |
1.15% |
174.15 |
|
| £65-70K |
1.62% |
0.91% |
178.96 |
|
| £70-75K |
1.32% |
0.72% |
183.25 |
|
| £75-80K |
1.08% |
0.57% |
187.09 |
|
| £80-85K |
0.88% |
0.46% |
190.53 |
|
| £85-90K |
0.73% |
0.37% |
193.62 |
|
| £90-95K |
0.60% |
0.31% |
196.42 |
|
| £95-100K |
0.50% |
0.25% |
198.96 |
|
| £100K + |
2.82% |
1.34% |
210.09 |
|
|
|

|


|
1992-1997
|
1997-2001
|
|
|
|
| Con |
-17.47% |
| Lab |
18.72% |
| LD |
-2.56% |
|
| Con |
-3.26% |
| Lab |
2.79% |
| LD |
4.28% |
|
|
 |
Tony McNulty
Labour hold
|
| Con |
 |
15,466 |
32.17% |
| Lab |
 |
26,590 |
55.31% |
| LD |
 |
6,021 |
12.52% |
| Oth |
|
0 |
0.00% |
| Maj |
 |
11,124 |
23.14% |
| Turn |
 |
48,077 |
58.94% |
|
|
 |
Tony McNulty
Labour hold
|
| LD |
George Kershaw |
6,021 |
12.52% |
| L |
Tony McNulty |
26,590 |
55.31% |
| C |
Peter Wilding |
15,466 |
32.17% |
|
Candidates representing 3 parties stood for election to this seat.
|
|
 |
Tony McNulty
Labour gain
|
| Con |
 |
20,189 |
35.43% |
| Lab |
 |
29,927 |
52.52% |
| LD |
 |
4,697 |
8.24% |
| Ref |
 |
1,537 |
2.70% |
| Oth |
 |
635 |
1.11% |
| Maj |
 |
9,738 |
17.09% |
| Turn |
 |
56,985 |
71.37% |
|
|
 |
|
Conservative
|
| Con |
 |
31,624 |
52.90% |
| Lab |
 |
20,219 |
33.80% |
| LD |
 |
6,471 |
10.80% |
| Oth |
 |
1,424 |
2.40% |
| Maj |
 |
11,405 |
19.10% |
| Turn |
 |
59,738 |
77.38% |
|
|
 |
|

|

