|
Harwich
Labour hold

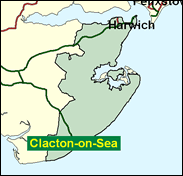
The Essex coastal constituency of Harwich saw the highest percentage polled anywhere in Britain by the Referendum Party, represented by Jeffrey Titford, a member of a prominent local family of undertakers. Mr Titford is now a European Parliament MP, elected on the regional list system in 1999; one wonders he has gone to that body to praise it or to bury it. Assisted by his intervention, Labour's Ivan Henderson pulled off an astonishing victory over the Conservative incumbent Iain Sproat (his third different constituency) in 1997. This gave this flying Dutchman among politicians more time to edit his annual Cricketer's Who's Who. Now Sproat tries to regain Harwich, surely his last port of call, at the age of 62. It might be assumed that with the Referendum tide having ebbed that he will certainly succeed; but it might not be a shoo-in. In May 1999, for example, Labour won in nine of the 20 Tendring District Council wards in the seat. The bulk of the population does not reside in the port of Harwich itself, but in the coastal resorts of (progressing up the self-ascribed social scale) Clacton, Walton on the Naze and Frinton on Sea. If Sproat does win, his majority will not reach anything like the 15,000 mark of the headier days of 1992 (when John Major, remember, won a surprise victory with an overall majority of just 21). How times change.

Ivan Henderson, born here in 1958 and a local dock worker who rose to become an RMT union organiser, is one of Labour's rare ex-manual worker MPs, elected here in 1997 for a seat never held by Labour. A short man, with a down-turned mouth, he tends to bowl loyalist questions, though tabled only five written ones in the first year. He faces a re-run against the former Tory MP Iain Sproat, born 1938, educated at Winchester and New College, Oxford and the second most likely Tory retread in the 2001 intake. A political nomad who progressed from 13 years as MP for Aberdeen South (1970-83), via an abortive attempt to win Roxbrough & Selkirk in 1983, to a political resurrection at Harwich in 1992, he obeyed the advice of Central Office for defeated MPs to stand in their old infantry trenches and not "chicken-run" to greener pastures. His reputation has somewhat mellowed from one as an abrasive backbencher to competent Sports Minister (1993-97) in the Major government. At 61 he will be one of the older new Tory MPs.
 |
| Wealthy Achievers, Suburban Areas |
7.61% |
14.99% |
50.78 |
|
| Affluent Greys, Rural Communities |
2.46% |
2.13% |
115.64 |
|
| Prosperous Pensioners, Retirement Areas |
36.14% |
2.49% |
1,453.53 |
|
| Affluent Executives, Family Areas |
0.23% |
4.43% |
5.13 |
|
| Well-Off Workers, Family Areas |
2.56% |
7.27% |
35.23 |
|
| Affluent Urbanites, Town & City Areas |
0.03% |
2.56% |
1.35 |
|
| Prosperous Professionals, Metropolitan Areas |
0.00% |
2.04% |
0.00 |
|
| Better-Off Executives, Inner City Areas |
3.81% |
3.94% |
96.51 |
|
| Comfortable Middle Agers, Mature Home Owning Areas |
12.88% |
13.04% |
98.80 |
|
| Skilled Workers, Home Owning Areas |
9.21% |
12.70% |
72.54 |
|
| New Home Owners, Mature Communities |
16.37% |
8.14% |
201.09 |
|
| White Collar Workers, Better-Off Multi Ethnic Areas |
1.86% |
4.02% |
46.30 |
|
| Older People, Less Prosperous Areas |
4.14% |
3.19% |
130.07 |
|
| Council Estate Residents, Better-Off Homes |
2.52% |
11.31% |
22.26 |
|
| Council Estate Residents, High Unemployment |
0.17% |
3.06% |
5.41 |
|
| Council Estate Residents, Greatest Hardship |
0.00% |
2.52% |
0.00 |
|
| People in Multi-Ethnic, Low-Income Areas |
0.00% |
2.10% |
0.00 |
|
| Unclassified |
0.00% |
0.06% |
0.00 |
|
|
 |
 |
 |
| £0-5K |
13.53% |
9.41% |
143.72 |
|
| £5-10K |
21.70% |
16.63% |
130.49 |
|
| £10-15K |
19.33% |
16.58% |
116.58 |
|
| £15-20K |
14.11% |
13.58% |
103.86 |
|
| £20-25K |
9.64% |
10.39% |
92.79 |
|
| £25-30K |
6.48% |
7.77% |
83.33 |
|
| £30-35K |
4.36% |
5.79% |
75.29 |
|
| £35-40K |
2.97% |
4.33% |
68.47 |
|
| £40-45K |
2.05% |
3.27% |
62.65 |
|
| £45-50K |
1.43% |
2.48% |
57.66 |
|
| £50-55K |
1.02% |
1.90% |
53.37 |
|
| £55-60K |
0.73% |
1.47% |
49.64 |
|
| £60-65K |
0.53% |
1.15% |
46.39 |
|
| £65-70K |
0.39% |
0.91% |
43.54 |
|
| £70-75K |
0.30% |
0.72% |
41.03 |
|
| £75-80K |
0.22% |
0.57% |
38.80 |
|
| £80-85K |
0.17% |
0.46% |
36.81 |
|
| £85-90K |
0.13% |
0.37% |
35.03 |
|
| £90-95K |
0.10% |
0.31% |
33.43 |
|
| £95-100K |
0.08% |
0.25% |
31.99 |
|
| £100K + |
0.35% |
1.34% |
25.68 |
|
|
|

|


|
1992-1997
|
1997-2001
|
|
|
|
| Con |
-15.22% |
| Lab |
14.06% |
| LD |
-10.05% |
|
| Con |
3.74% |
| Lab |
6.87% |
| LD |
-4.63% |
|
|
 |
Ivan Henderson
Labour hold
|
| Con |
 |
19,355 |
40.23% |
| Lab |
 |
21,951 |
45.62% |
| LD |
 |
4,099 |
8.52% |
| Oth |
 |
2,710 |
5.63% |
| Maj |
 |
2,596 |
5.40% |
| Turn |
 |
48,115 |
62.05% |
|
|
 |
Ivan Henderson
Labour hold
|
| UK |
Tony Finnegan-Butler |
2,463 |
5.12% |
| L |
Ivan Henderson |
21,951 |
45.62% |
| I |
Clive Lawrence |
247 |
0.51% |
| C |
Ian Sproat |
19,355 |
40.23% |
| LD |
Peter Wilcock |
4,099 |
8.52% |
|
Candidates representing 5 parties stood for election to this seat.
|
|
 |
Ivan Henderson
Labour gain
|
| Con |
 |
19,524 |
36.48% |
| Lab |
 |
20,740 |
38.76% |
| LD |
 |
7,037 |
13.15% |
| Ref |
 |
4,923 |
9.20% |
| Oth |
 |
1,290 |
2.41% |
| Maj |
 |
1,216 |
2.27% |
| Turn |
 |
53,514 |
70.62% |
|
|
 |
|
Conservative
|
| Con |
 |
29,372 |
51.70% |
| Lab |
 |
14,047 |
24.70% |
| LD |
 |
13,187 |
23.20% |
| Oth |
 |
256 |
0.50% |
| Maj |
 |
15,325 |
27.00% |
| Turn |
 |
56,862 |
76.14% |
|
|
 |
|

|

