|
Hastings & Rye
Labour hold

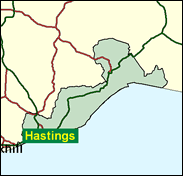
Like so many south coast resorts, Hastings may now be demonstrating a long-term decline, and a long-term movement towards Labour. It shows signs of going to seed, and many of the guest houses have been converted for use by social security claimants. Having won for the first time in 1997, the party is fairly well established in local elections, and may be able to squeeze a large municipal Liberal Democrat vote to keep the Tories out again at the next Election. Fiona Pitt-Kethley, the poet who lives in Hastings, wrote before the last election that there was little point in voting as she assumed the seat was safely Tory. This is far from being the case any more, or in foreseeable times to come.

Michael Jabez Foster, PPS to the Law Officers, won this seat in 1997 as Labour's second least expected MP. A native son of Hastings, born 1946 and educated at Hastings Grammar School and Leicester University, he has long been active in both Hastings Borough Council and East Sussex County Council and was a local solicitor for nearly twenty years, specialising in employment law. A Methodist, he employs his biblical middle name only to distinguish himself from the anti-hunting Michael Foster, MP for Worcester, whose hate mail from hunting enthusiasts otherwise comes to him. He campaigns on the social problems in Hastings, which were responsible for his election as the first non-Tory MP in 95 years. Despite his fluent advocacy of local needs, not least the jobs-creating Hastings by-pass, he is threatened by schoolteacher Mark Coote, running for the Conservatives. Born 1961 and educated at Cheltenham Grammar School and Nottingham and London Universities, Coote edits Ann Widdecombe's 'Widdy Web' website, and supplied a chapter on 'rationalising healthcare' to a Millennium Think Tank publication "Clear Blue Water".
 |
| Wealthy Achievers, Suburban Areas |
7.63% |
14.99% |
50.87 |
|
| Affluent Greys, Rural Communities |
2.03% |
2.13% |
95.69 |
|
| Prosperous Pensioners, Retirement Areas |
10.50% |
2.49% |
422.41 |
|
| Affluent Executives, Family Areas |
4.50% |
4.43% |
101.63 |
|
| Well-Off Workers, Family Areas |
2.33% |
7.27% |
32.05 |
|
| Affluent Urbanites, Town & City Areas |
0.00% |
2.56% |
0.00 |
|
| Prosperous Professionals, Metropolitan Areas |
0.00% |
2.04% |
0.00 |
|
| Better-Off Executives, Inner City Areas |
14.65% |
3.94% |
371.45 |
|
| Comfortable Middle Agers, Mature Home Owning Areas |
16.11% |
13.04% |
123.56 |
|
| Skilled Workers, Home Owning Areas |
10.49% |
12.70% |
82.54 |
|
| New Home Owners, Mature Communities |
8.34% |
8.14% |
102.48 |
|
| White Collar Workers, Better-Off Multi Ethnic Areas |
9.36% |
4.02% |
232.68 |
|
| Older People, Less Prosperous Areas |
2.31% |
3.19% |
72.40 |
|
| Council Estate Residents, Better-Off Homes |
7.78% |
11.31% |
68.79 |
|
| Council Estate Residents, High Unemployment |
1.95% |
3.06% |
63.74 |
|
| Council Estate Residents, Greatest Hardship |
2.02% |
2.52% |
80.29 |
|
| People in Multi-Ethnic, Low-Income Areas |
0.00% |
2.10% |
0.00 |
|
| Unclassified |
0.00% |
0.06% |
0.00 |
|
|
 |
 |
 |
| £0-5K |
11.87% |
9.41% |
126.13 |
|
| £5-10K |
20.28% |
16.63% |
121.95 |
|
| £10-15K |
18.97% |
16.58% |
114.39 |
|
| £15-20K |
14.40% |
13.58% |
106.05 |
|
| £20-25K |
10.18% |
10.39% |
97.94 |
|
| £25-30K |
7.03% |
7.77% |
90.44 |
|
| £30-35K |
4.85% |
5.79% |
83.65 |
|
| £35-40K |
3.36% |
4.33% |
77.57 |
|
| £40-45K |
2.36% |
3.27% |
72.15 |
|
| £45-50K |
1.67% |
2.48% |
67.31 |
|
| £50-55K |
1.20% |
1.90% |
62.99 |
|
| £55-60K |
0.87% |
1.47% |
59.12 |
|
| £60-65K |
0.64% |
1.15% |
55.65 |
|
| £65-70K |
0.48% |
0.91% |
52.52 |
|
| £70-75K |
0.36% |
0.72% |
49.68 |
|
| £75-80K |
0.27% |
0.57% |
47.11 |
|
| £80-85K |
0.21% |
0.46% |
44.78 |
|
| £85-90K |
0.16% |
0.37% |
42.64 |
|
| £90-95K |
0.12% |
0.31% |
40.68 |
|
| £95-100K |
0.10% |
0.25% |
38.88 |
|
| £100K + |
0.41% |
1.34% |
30.46 |
|
|
|

|


|
1992-1997
|
1997-2001
|
|
|
|
| Con |
-18.44% |
| Lab |
18.67% |
| LD |
-7.25% |
|
| Con |
7.46% |
| Lab |
12.70% |
| LD |
-17.60% |
|
|
 |
Michael Foster
Labour hold
|
| Con |
 |
15,094 |
36.62% |
| Lab |
 |
19,402 |
47.07% |
| LD |
 |
4,266 |
10.35% |
| Oth |
 |
2,456 |
5.96% |
| Maj |
 |
4,308 |
10.45% |
| Turn |
 |
41,218 |
58.36% |
|
|
 |
Michael Foster
Labour hold
|
| I |
Gillian Bargery |
486 |
1.18% |
| UK |
Alan Coomber |
911 |
2.21% |
| C |
Mark Coote |
15,094 |
36.62% |
| L |
Michael Foster |
19,402 |
47.07% |
| RRL |
Brett McLean |
140 |
0.34% |
| ML |
John Ord-Clarke |
198 |
0.48% |
| LD |
Graem Peters |
4,266 |
10.35% |
| G |
Sally Phillips |
721 |
1.75% |
|
Candidates representing 8 parties stood for election to this seat.
|
|
 |
Michael Foster
Labour gain
|
| Con |
 |
14,307 |
29.16% |
| Lab |
 |
16,867 |
34.37% |
| LD |
 |
13,717 |
27.95% |
| Ref |
 |
2,511 |
5.12% |
| Oth |
 |
1,667 |
3.40% |
| Maj |
 |
2,560 |
5.22% |
| Turn |
 |
49,069 |
69.71% |
|
|
 |
|
Conservative
|
| Con |
 |
25,573 |
47.60% |
| Lab |
 |
8,458 |
15.70% |
| LD |
 |
18,939 |
35.20% |
| Oth |
 |
808 |
1.50% |
| Maj |
 |
6,634 |
12.30% |
| Turn |
 |
53,778 |
73.52% |
|
|
 |
|

|

