|
Hayes & Harlington
Labour hold

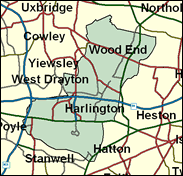
One of the most convincing of Labour's gains in 1997, Hayes and Harlington looks every bit the part of a safe seat, and it is hard to credit that it was actually held by the Conservatives for 14 years beforehand. This southern section of the outer west London Borough of Hillingdon is a mixture of essentially a white working class majority, and 20 per cent ethnic minorities, within which Sikhs are prominent. It includes almost the whole of Heathrow Airport, and the communities nearby of Yeading, Wood End and Harmondsworth. Labour's problems started when their sitting MP Neville Sandelson defected to the newly formed SDP in the early 1980s, then the entertaining right winger Terry Dicks won three times, by just 53 votes in 1992 when Labour posters easily outnumbered his, which proudly proclaimed I LOVE DICKS. In 1997 Dicks had moved on, and his 1992 opponent John McDonnell inherited the seat with a huge majority of over 14,000. With McDonnell's Left-wing and rebellious political stance, though, it can still not be said to be safely in New Labour hands - perhaps the last time it was in the day of Neville Sandelson.

John McDonnell is the Labour MP to whom the term 'usual suspects' more than adequately applies. With no backbench revolt ungraced by his presence, from lone parent benefit cuts in 1997, to air traffic control privatisation in 2000, elected here in 1997, he is a throwback to the GLC when he actually fell out with Livingstone over trimming on setting a rate. Of Liverpool Irish background, he was born in 1951 and educated all over the place in Great Yarmouth and Burnley and at Brunel University and Birkbeck College, London. Slight and good-looking with aquiline features, he has spent a lifetime as a political apparatchik either in Unions or local government, and with no prospects for this unreconstructed Campaign Grouper at Westminster, he has climbed back onto Livingstone's resuscitated London bandwagon.
 |
| Wealthy Achievers, Suburban Areas |
0.03% |
14.99% |
0.22 |
|
| Affluent Greys, Rural Communities |
0.00% |
2.13% |
0.00 |
|
| Prosperous Pensioners, Retirement Areas |
0.06% |
2.49% |
2.22 |
|
| Affluent Executives, Family Areas |
4.23% |
4.43% |
95.70 |
|
| Well-Off Workers, Family Areas |
7.25% |
7.27% |
99.74 |
|
| Affluent Urbanites, Town & City Areas |
9.14% |
2.56% |
356.42 |
|
| Prosperous Professionals, Metropolitan Areas |
0.00% |
2.04% |
0.00 |
|
| Better-Off Executives, Inner City Areas |
0.50% |
3.94% |
12.73 |
|
| Comfortable Middle Agers, Mature Home Owning Areas |
9.77% |
13.04% |
74.95 |
|
| Skilled Workers, Home Owning Areas |
12.90% |
12.70% |
101.56 |
|
| New Home Owners, Mature Communities |
10.04% |
8.14% |
123.24 |
|
| White Collar Workers, Better-Off Multi Ethnic Areas |
24.16% |
4.02% |
600.87 |
|
| Older People, Less Prosperous Areas |
5.51% |
3.19% |
173.08 |
|
| Council Estate Residents, Better-Off Homes |
13.79% |
11.31% |
121.92 |
|
| Council Estate Residents, High Unemployment |
1.19% |
3.06% |
38.90 |
|
| Council Estate Residents, Greatest Hardship |
0.22% |
2.52% |
8.92 |
|
| People in Multi-Ethnic, Low-Income Areas |
1.14% |
2.10% |
54.37 |
|
| Unclassified |
0.04% |
0.06% |
71.26 |
|
|
 |
 |
 |
| £0-5K |
6.59% |
9.41% |
70.01 |
|
| £5-10K |
13.31% |
16.63% |
80.01 |
|
| £10-15K |
15.23% |
16.58% |
91.87 |
|
| £15-20K |
13.87% |
13.58% |
102.10 |
|
| £20-25K |
11.43% |
10.39% |
110.03 |
|
| £25-30K |
9.00% |
7.77% |
115.77 |
|
| £30-35K |
6.93% |
5.79% |
119.69 |
|
| £35-40K |
5.29% |
4.33% |
122.14 |
|
| £40-45K |
4.03% |
3.27% |
123.45 |
|
| £45-50K |
3.08% |
2.48% |
123.90 |
|
| £50-55K |
2.36% |
1.90% |
123.70 |
|
| £55-60K |
1.81% |
1.47% |
123.02 |
|
| £60-65K |
1.40% |
1.15% |
122.00 |
|
| £65-70K |
1.09% |
0.91% |
120.72 |
|
| £70-75K |
0.86% |
0.72% |
119.27 |
|
| £75-80K |
0.68% |
0.57% |
117.70 |
|
| £80-85K |
0.54% |
0.46% |
116.05 |
|
| £85-90K |
0.43% |
0.37% |
114.36 |
|
| £90-95K |
0.34% |
0.31% |
112.65 |
|
| £95-100K |
0.28% |
0.25% |
110.94 |
|
| £100K + |
1.35% |
1.34% |
100.12 |
|
|
|

|


|
1992-1997
|
1997-2001
|
|
|
|
| Con |
-17.72% |
| Lab |
17.16% |
| LD |
-2.88% |
|
| Con |
-3.06% |
| Lab |
3.71% |
| LD |
-1.38% |
|
|
 |
John McDonnell
Labour hold
|
| Con |
 |
7,813 |
24.11% |
| Lab |
 |
21,279 |
65.67% |
| LD |
 |
1,958 |
6.04% |
| Oth |
 |
1,353 |
4.18% |
| Maj |
 |
13,466 |
41.56% |
| Turn |
 |
32,403 |
56.29% |
|
|
 |
John McDonnell
Labour hold
|
| LD |
Nahid Boethe |
1,958 |
6.04% |
| BNP |
Gary Burch |
705 |
2.18% |
| SA |
Wally Kennedy |
648 |
2.00% |
| L |
John McDonnell |
21,279 |
65.67% |
| C |
Robert McLean |
7,813 |
24.11% |
|
Candidates representing 5 parties stood for election to this seat.
|
|
 |
John McDonnell
Labour gain
|
| Con |
 |
11,167 |
27.18% |
| Lab |
 |
25,458 |
61.96% |
| LD |
 |
3,049 |
7.42% |
| Ref |
 |
778 |
1.89% |
| Oth |
 |
639 |
1.56% |
| Maj |
 |
14,291 |
34.78% |
| Turn |
 |
41,091 |
72.31% |
|
|
 |
|
Conservative
|
| Con |
 |
19,511 |
44.90% |
| Lab |
 |
19,467 |
44.80% |
| LD |
 |
4,477 |
10.30% |
| Oth |
|
0 |
0.00% |
| Maj |
 |
44 |
0.10% |
| Turn |
 |
43,455 |
74.07% |
|
|
 |
|

|

