|
Hazel Grove
Liberal Democrat hold

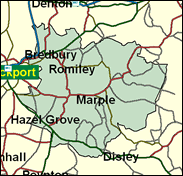
Having finally dislodged the Conservatives after the retirement of Tom Arnold, the Liberal Democrat Andrew Stunell now enjoys one of their safest strongholds in Hazel Grove, where in May 2000, for example, his party won all six Stockport Borough wards easily, and he may well achieve another five figure majority. This seat in the south east corner of Greater Manchester near the border with the Peak District has a long Liberal tradition, dating back to the victories of Dr Michael Winstanley in 1966 (when it was part of the Cheadle constituency) and February 1974. Tom Arnold did astonishingly well to hold on narrowly on five occasions in succession - enough people must have met him to have been bowled over by his twinkling charm. Andrew Stunell may win several terms too, though perhaps by different methods and for different reasons.

Andrew Stunell, Liberal Democrat Deputy Chief Whip, won here in 1997 after narrowly missing victory in 1992. An architect, born in the Surrey suburbs in 1942, he was educated at Surbiton Grammar School, Kingston Polytechnic and Manchester University. Environmentally concerned - in the Liberal mode - he has introduced a Bill to reduce 'unnecessary over-packaging'. With experience of a Lib-Con coalition on Cheshire County Council, he is no automatic endorser of Charles Kennedy's tacit packaging of the Liberals as a primarily anti-Tory party.
 |
| Wealthy Achievers, Suburban Areas |
25.72% |
14.99% |
171.55 |
|
| Affluent Greys, Rural Communities |
0.00% |
2.13% |
0.00 |
|
| Prosperous Pensioners, Retirement Areas |
1.69% |
2.49% |
67.82 |
|
| Affluent Executives, Family Areas |
5.91% |
4.43% |
133.49 |
|
| Well-Off Workers, Family Areas |
11.89% |
7.27% |
163.44 |
|
| Affluent Urbanites, Town & City Areas |
0.20% |
2.56% |
7.89 |
|
| Prosperous Professionals, Metropolitan Areas |
0.05% |
2.04% |
2.45 |
|
| Better-Off Executives, Inner City Areas |
0.00% |
3.94% |
0.00 |
|
| Comfortable Middle Agers, Mature Home Owning Areas |
24.40% |
13.04% |
187.16 |
|
| Skilled Workers, Home Owning Areas |
9.14% |
12.70% |
71.99 |
|
| New Home Owners, Mature Communities |
8.61% |
8.14% |
105.72 |
|
| White Collar Workers, Better-Off Multi Ethnic Areas |
0.45% |
4.02% |
11.16 |
|
| Older People, Less Prosperous Areas |
3.75% |
3.19% |
117.60 |
|
| Council Estate Residents, Better-Off Homes |
6.09% |
11.31% |
53.85 |
|
| Council Estate Residents, High Unemployment |
1.00% |
3.06% |
32.51 |
|
| Council Estate Residents, Greatest Hardship |
1.09% |
2.52% |
43.26 |
|
| People in Multi-Ethnic, Low-Income Areas |
0.00% |
2.10% |
0.00 |
|
| Unclassified |
0.02% |
0.06% |
24.83 |
|
|
 |
 |
 |
| £0-5K |
7.11% |
9.41% |
75.49 |
|
| £5-10K |
14.25% |
16.63% |
85.65 |
|
| £10-15K |
15.62% |
16.58% |
94.20 |
|
| £15-20K |
13.76% |
13.58% |
101.27 |
|
| £20-25K |
11.11% |
10.39% |
106.88 |
|
| £25-30K |
8.64% |
7.77% |
111.18 |
|
| £30-35K |
6.62% |
5.79% |
114.37 |
|
| £35-40K |
5.05% |
4.33% |
116.62 |
|
| £40-45K |
3.86% |
3.27% |
118.09 |
|
| £45-50K |
2.95% |
2.48% |
118.95 |
|
| £50-55K |
2.27% |
1.90% |
119.30 |
|
| £55-60K |
1.76% |
1.47% |
119.26 |
|
| £60-65K |
1.37% |
1.15% |
118.89 |
|
| £65-70K |
1.07% |
0.91% |
118.28 |
|
| £70-75K |
0.84% |
0.72% |
117.48 |
|
| £75-80K |
0.67% |
0.57% |
116.53 |
|
| £80-85K |
0.53% |
0.46% |
115.47 |
|
| £85-90K |
0.43% |
0.37% |
114.33 |
|
| £90-95K |
0.35% |
0.31% |
113.13 |
|
| £95-100K |
0.28% |
0.25% |
111.89 |
|
| £100K + |
1.39% |
1.34% |
103.24 |
|
|
|

|


|
1992-1997
|
1997-2001
|
|
|
|
| Con |
-14.26% |
| Lab |
0.22% |
| LD |
11.39% |
|
| Con |
-0.43% |
| Lab |
4.27% |
| LD |
-2.46% |
|
|
 |
Andrew Stunell
Liberal Democrat hold
|
| Con |
 |
11,585 |
30.11% |
| Lab |
 |
6,230 |
16.19% |
| LD |
 |
20,020 |
52.03% |
| Oth |
 |
643 |
1.67% |
| Maj |
 |
8,435 |
21.92% |
| Turn |
 |
38,478 |
59.10% |
|
|
 |
Andrew Stunell
Liberal Democrat hold
|
| C |
Nadine Bargery |
11,585 |
30.11% |
| L |
Martin Miller |
6,230 |
16.19% |
| UK |
Gerald Price |
643 |
1.67% |
| LD |
Andrew Stunell |
20,020 |
52.03% |
|
Candidates representing 4 parties stood for election to this seat.
|
|
 |
Andrew Stunell
Liberal Democrat gain
|
| Con |
 |
15,069 |
30.54% |
| Lab |
 |
5,882 |
11.92% |
| LD |
 |
26,883 |
54.49% |
| Ref |
 |
1,055 |
2.14% |
| Oth |
 |
451 |
0.91% |
| Maj |
 |
11,814 |
23.94% |
| Turn |
 |
49,340 |
77.46% |
|
|
 |
|
Conservative
|
| Con |
 |
24,479 |
44.80% |
| Lab |
 |
6,390 |
11.70% |
| LD |
 |
23,550 |
43.10% |
| Oth |
 |
204 |
0.40% |
| Maj |
 |
929 |
1.70% |
| Turn |
 |
54,623 |
83.59% |
|
|
 |
|

|

