|
Basingstoke
Conservative hold

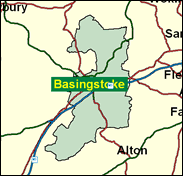
Basingstoke is a very modern constituency in the M3 corridor, with rapid office, hi-tech, light industrial and housing development in recent decades. There are plenty of affluent villages too, popular with commuters and frequently expanded with "executive" developments. In the 18 year period of Tory government Basingstoke was a real success story for the Conservatives, and in 1992 Andrew Hunter's majority was about 18,000. Yet New Labour showed they could appeal to modern Britain, and their candidate Nigel Lickley lost by only 2,397 in 1997. This is the sort of seat that is sufficiently rootless that Labour could actually win it one day. High swings are clearly possible, and much will depend on the continually expanding electorate's view of which prospective governing party would put more money in its pockets.

Tall and burly pipesmoking Andrew Hunter has been MP here since 1983. He is a hard rightwinger as a former defender of white South Africa and as one of a small Tory rump which votes with hardline Unionists against all power sharing in Northern Ireland. Born 1943 and educated at St Georges School, Harpenden, Jesus College, Cambridge, and (ecclesiastically) at Westcott House,Cambridge, he was a Classics master at Harrow for 12 years.
 |
| Wealthy Achievers, Suburban Areas |
15.35% |
14.99% |
102.35 |
|
| Affluent Greys, Rural Communities |
0.32% |
2.13% |
15.18 |
|
| Prosperous Pensioners, Retirement Areas |
0.78% |
2.49% |
31.35 |
|
| Affluent Executives, Family Areas |
22.57% |
4.43% |
510.14 |
|
| Well-Off Workers, Family Areas |
7.32% |
7.27% |
100.61 |
|
| Affluent Urbanites, Town & City Areas |
3.19% |
2.56% |
124.54 |
|
| Prosperous Professionals, Metropolitan Areas |
0.26% |
2.04% |
12.62 |
|
| Better-Off Executives, Inner City Areas |
0.60% |
3.94% |
15.26 |
|
| Comfortable Middle Agers, Mature Home Owning Areas |
6.25% |
13.04% |
47.93 |
|
| Skilled Workers, Home Owning Areas |
9.31% |
12.70% |
73.31 |
|
| New Home Owners, Mature Communities |
4.36% |
8.14% |
53.57 |
|
| White Collar Workers, Better-Off Multi Ethnic Areas |
0.66% |
4.02% |
16.40 |
|
| Older People, Less Prosperous Areas |
3.98% |
3.19% |
124.94 |
|
| Council Estate Residents, Better-Off Homes |
24.04% |
11.31% |
212.56 |
|
| Council Estate Residents, High Unemployment |
0.32% |
3.06% |
10.48 |
|
| Council Estate Residents, Greatest Hardship |
0.46% |
2.52% |
18.32 |
|
| People in Multi-Ethnic, Low-Income Areas |
0.00% |
2.10% |
0.00 |
|
| Unclassified |
0.22% |
0.06% |
349.63 |
|
|
 |
 |
 |
| £0-5K |
5.56% |
9.41% |
59.11 |
|
| £5-10K |
11.84% |
16.63% |
71.16 |
|
| £10-15K |
13.73% |
16.58% |
82.84 |
|
| £15-20K |
12.73% |
13.58% |
93.74 |
|
| £20-25K |
10.79% |
10.39% |
103.78 |
|
| £25-30K |
8.78% |
7.77% |
113.00 |
|
| £30-35K |
7.03% |
5.79% |
121.43 |
|
| £35-40K |
5.59% |
4.33% |
129.10 |
|
| £40-45K |
4.44% |
3.27% |
136.02 |
|
| £45-50K |
3.53% |
2.48% |
142.23 |
|
| £50-55K |
2.81% |
1.90% |
147.77 |
|
| £55-60K |
2.25% |
1.47% |
152.66 |
|
| £60-65K |
1.81% |
1.15% |
156.97 |
|
| £65-70K |
1.46% |
0.91% |
160.75 |
|
| £70-75K |
1.18% |
0.72% |
164.03 |
|
| £75-80K |
0.96% |
0.57% |
166.86 |
|
| £80-85K |
0.78% |
0.46% |
169.30 |
|
| £85-90K |
0.64% |
0.37% |
171.37 |
|
| £90-95K |
0.53% |
0.31% |
173.12 |
|
| £95-100K |
0.44% |
0.25% |
174.58 |
|
| £100K + |
2.38% |
1.34% |
177.00 |
|
|
|

|


|
1992-1997
|
1997-2001
|
|
|
|
| Con |
-10.18% |
| Lab |
14.03% |
| LD |
-3.40% |
|
| Con |
-0.63% |
| Lab |
1.73% |
| LD |
-3.06% |
|
|
 |
Andrew Hunter
Conservative hold
|
| Con |
 |
20,490 |
42.69% |
| Lab |
 |
19,610 |
40.86% |
| LD |
 |
6,693 |
13.95% |
| Oth |
 |
1,202 |
2.50% |
| Maj |
 |
880 |
1.83% |
| Turn |
 |
47,995 |
60.67% |
|
|
 |
Andrew Hunter
Conservative hold
|
| UK |
Kim-Elisabeth Graham |
1,202 |
2.50% |
| L |
Jon Hartley |
19,610 |
40.86% |
| C |
Andrew Hunter |
20,490 |
42.69% |
| LD |
Steve Sollitt |
6,693 |
13.95% |
|
Candidates representing 4 parties stood for election to this seat.
|
|
 |
Andrew Hunter
Conservative
|
| Con |
 |
24,751 |
43.32% |
| Lab |
 |
22,354 |
39.13% |
| LD |
 |
9,714 |
17.00% |
| Ref |
|
0 |
0.00% |
| Oth |
 |
310 |
0.54% |
| Maj |
 |
2,397 |
4.20% |
| Turn |
 |
57,129 |
74.16% |
|
|
 |
|
Conservative
|
| Con |
 |
33,695 |
53.50% |
| Lab |
 |
15,809 |
25.10% |
| LD |
 |
12,819 |
20.40% |
| Oth |
 |
653 |
1.00% |
| Maj |
 |
17,886 |
28.40% |
| Turn |
 |
62,976 |
83.63% |
|
|
 |
|

|

