|
Hemel Hempstead
Conservative gain

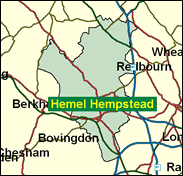
If the Conservatives do not recover seats like Hemel Hempstead in west Hertfordshire, they will come nowhere near approaching governmental office again. This is exactly the sort of seat which may be expected to produce the closest of contests in the 2001 General Election that almost everyone anticipates. A mixture of affluent south east England suburbia and one of the most prosperous of the post-war Reith Commission new towns, it would take a 3.3 per cent swing to dislodge Tony McWalter. This could happen with Labour still holding an overall majority of 100 though, so the Conservatives must hope that he will not even come close again.

Tony McWalter, Labour's balding, red-faced victor here in 1997, cuts an eccentric dash as a Kantian philosopher, who prudently avoids discussing his hero on the doorsteps of Hemel Hempstead. Born 1945 and educated at St. Benedict's (RC), Ealing, he collected four degrees at Aberystwyth and McMaster Universities, and at University College, Oxford. An ex-poly lecturer for 25 years, in philosophy and computing, his Catholicism is reflected in an interest in Northern Ireland, his Kantian idealism in abstentions on lone parent and disability benefit cuts, and his political defeat - which doubtless he will take philosophically - rests with the Tory challenger.
 |
| Wealthy Achievers, Suburban Areas |
21.17% |
14.99% |
141.21 |
|
| Affluent Greys, Rural Communities |
0.00% |
2.13% |
0.00 |
|
| Prosperous Pensioners, Retirement Areas |
0.59% |
2.49% |
23.78 |
|
| Affluent Executives, Family Areas |
3.89% |
4.43% |
88.02 |
|
| Well-Off Workers, Family Areas |
8.80% |
7.27% |
120.96 |
|
| Affluent Urbanites, Town & City Areas |
3.93% |
2.56% |
153.33 |
|
| Prosperous Professionals, Metropolitan Areas |
1.58% |
2.04% |
77.56 |
|
| Better-Off Executives, Inner City Areas |
1.49% |
3.94% |
37.88 |
|
| Comfortable Middle Agers, Mature Home Owning Areas |
11.86% |
13.04% |
90.94 |
|
| Skilled Workers, Home Owning Areas |
7.78% |
12.70% |
61.23 |
|
| New Home Owners, Mature Communities |
11.00% |
8.14% |
135.13 |
|
| White Collar Workers, Better-Off Multi Ethnic Areas |
0.47% |
4.02% |
11.71 |
|
| Older People, Less Prosperous Areas |
3.59% |
3.19% |
112.78 |
|
| Council Estate Residents, Better-Off Homes |
22.35% |
11.31% |
197.62 |
|
| Council Estate Residents, High Unemployment |
1.04% |
3.06% |
33.81 |
|
| Council Estate Residents, Greatest Hardship |
0.43% |
2.52% |
17.06 |
|
| People in Multi-Ethnic, Low-Income Areas |
0.00% |
2.10% |
0.00 |
|
| Unclassified |
0.01% |
0.06% |
23.25 |
|
|
 |
 |
 |
| £0-5K |
6.86% |
9.41% |
72.86 |
|
| £5-10K |
12.80% |
16.63% |
76.94 |
|
| £10-15K |
14.22% |
16.58% |
85.75 |
|
| £15-20K |
12.91% |
13.58% |
95.01 |
|
| £20-25K |
10.77% |
10.39% |
103.63 |
|
| £25-30K |
8.65% |
7.77% |
111.32 |
|
| £30-35K |
6.84% |
5.79% |
118.05 |
|
| £35-40K |
5.37% |
4.33% |
123.91 |
|
| £40-45K |
4.21% |
3.27% |
128.99 |
|
| £45-50K |
3.31% |
2.48% |
133.42 |
|
| £50-55K |
2.61% |
1.90% |
137.28 |
|
| £55-60K |
2.07% |
1.47% |
140.65 |
|
| £60-65K |
1.65% |
1.15% |
143.62 |
|
| £65-70K |
1.33% |
0.91% |
146.24 |
|
| £70-75K |
1.07% |
0.72% |
148.56 |
|
| £75-80K |
0.87% |
0.57% |
150.62 |
|
| £80-85K |
0.71% |
0.46% |
152.46 |
|
| £85-90K |
0.58% |
0.37% |
154.10 |
|
| £90-95K |
0.47% |
0.31% |
155.58 |
|
| £95-100K |
0.39% |
0.25% |
156.90 |
|
| £100K + |
2.18% |
1.34% |
162.09 |
|
|
|

|


|
1992-1997
|
1997-2001
|
|
|
|
| Con |
-10.80% |
| Lab |
13.20% |
| LD |
-3.08% |
|
| Con |
0.20% |
| Lab |
-45.70% |
| LD |
0.76% |
|
|
 |
Tony McWalter
Conservative gain
|
| Con |
 |
17,647 |
39.29% |
| Lab |
|
0 |
0.00% |
| LD |
 |
5,877 |
13.09% |
| Oth |
 |
21,389 |
47.62% |
| Maj |
 |
11,770 |
26.21% |
| Turn |
 |
44,913 |
62.30% |
|
|
 |
Tony McWalter
Conservative gain
|
| C |
Paul Ivey |
17,647 |
39.29% |
| LC |
Tony McWalter |
21,389 |
47.62% |
|
Barry Newton |
0 |
0.00% |
| LD |
Neil Stuart |
5,877 |
13.09% |
|
Candidates representing 4 parties stood for election to this seat.
|
|
 |
Tony McWalter
Labour gain
|
| Con |
 |
21,539 |
39.10% |
| Lab |
 |
25,175 |
45.70% |
| LD |
 |
6,789 |
12.32% |
| Ref |
 |
1,327 |
2.41% |
| Oth |
 |
262 |
0.48% |
| Maj |
 |
3,636 |
6.60% |
| Turn |
 |
55,092 |
77.09% |
|
|
 |
|
Conservative
|
| Con |
 |
29,248 |
49.90% |
| Lab |
 |
19,090 |
32.50% |
| LD |
 |
9,005 |
15.40% |
| Oth |
 |
1,313 |
2.20% |
| Maj |
 |
10,158 |
17.30% |
| Turn |
 |
58,656 |
82.07% |
|
|
 |
|

|

