|
Hemsworth
Labour hold

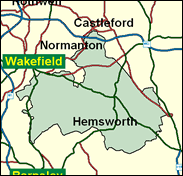
Once the Yorkshire mining seat with the largest of all Labour majorities (34,000 in 1966), Hemsworth has been slimmed down by boundary changes and very slightly diluted by the addition of the middle class and even Conservative Wakefield South ward. There are now 53 seats technically safer than Jon Trickett's here, but once we reach these levels it scarcely matters.

John Trickett is a former Bennite Leeds councillor who via leadership of Leeds Council won this seat in 1996, and crowned his rightward trajectory by becoming PPS to Peter Mandelson. A former plumber and builder, he was born 1950 and educated at Roundhay School, Leeds and studied politics at Hull and Leeds Universities. Given his leftist past, it was ironic that he was the first Labour candidate to be opposed by a Scargill Socialist whom he saw off, and then attacked Scargill for lacking the guts himself to face the humiliation of polling only 1,200 votes.
 |
| Wealthy Achievers, Suburban Areas |
11.36% |
14.99% |
75.80 |
|
| Affluent Greys, Rural Communities |
0.04% |
2.13% |
1.97 |
|
| Prosperous Pensioners, Retirement Areas |
0.07% |
2.49% |
2.73 |
|
| Affluent Executives, Family Areas |
3.61% |
4.43% |
81.55 |
|
| Well-Off Workers, Family Areas |
9.06% |
7.27% |
124.57 |
|
| Affluent Urbanites, Town & City Areas |
0.22% |
2.56% |
8.73 |
|
| Prosperous Professionals, Metropolitan Areas |
0.01% |
2.04% |
0.44 |
|
| Better-Off Executives, Inner City Areas |
0.00% |
3.94% |
0.00 |
|
| Comfortable Middle Agers, Mature Home Owning Areas |
6.51% |
13.04% |
49.91 |
|
| Skilled Workers, Home Owning Areas |
25.91% |
12.70% |
203.97 |
|
| New Home Owners, Mature Communities |
16.94% |
8.14% |
208.01 |
|
| White Collar Workers, Better-Off Multi Ethnic Areas |
0.00% |
4.02% |
0.00 |
|
| Older People, Less Prosperous Areas |
5.52% |
3.19% |
173.42 |
|
| Council Estate Residents, Better-Off Homes |
18.37% |
11.31% |
162.42 |
|
| Council Estate Residents, High Unemployment |
0.41% |
3.06% |
13.48 |
|
| Council Estate Residents, Greatest Hardship |
1.96% |
2.52% |
77.80 |
|
| People in Multi-Ethnic, Low-Income Areas |
0.00% |
2.10% |
0.00 |
|
| Unclassified |
0.00% |
0.06% |
0.00 |
|
|
 |
 |
 |
| £0-5K |
12.27% |
9.41% |
130.31 |
|
| £5-10K |
20.27% |
16.63% |
121.90 |
|
| £10-15K |
18.48% |
16.58% |
111.48 |
|
| £15-20K |
13.86% |
13.58% |
102.00 |
|
| £20-25K |
9.77% |
10.39% |
93.98 |
|
| £25-30K |
6.79% |
7.77% |
87.35 |
|
| £30-35K |
4.74% |
5.79% |
81.91 |
|
| £35-40K |
3.36% |
4.33% |
77.48 |
|
| £40-45K |
2.41% |
3.27% |
73.86 |
|
| £45-50K |
1.76% |
2.48% |
70.91 |
|
| £50-55K |
1.30% |
1.90% |
68.52 |
|
| £55-60K |
0.98% |
1.47% |
66.58 |
|
| £60-65K |
0.75% |
1.15% |
65.00 |
|
| £65-70K |
0.58% |
0.91% |
63.74 |
|
| £70-75K |
0.45% |
0.72% |
62.72 |
|
| £75-80K |
0.36% |
0.57% |
61.91 |
|
| £80-85K |
0.28% |
0.46% |
61.26 |
|
| £85-90K |
0.23% |
0.37% |
60.76 |
|
| £90-95K |
0.18% |
0.31% |
60.38 |
|
| £95-100K |
0.15% |
0.25% |
60.09 |
|
| £100K + |
0.81% |
1.34% |
59.96 |
|
|
|

|


|
1992-1997
|
1997-2001
|
|
|
|
| Con |
-8.00% |
| Lab |
6.76% |
| LD |
-1.53% |
|
| Con |
3.20% |
| Lab |
-5.17% |
| LD |
2.46% |
|
|
 |
Jon Trickett
Labour hold
|
| Con |
 |
7,400 |
21.01% |
| Lab |
 |
23,036 |
65.39% |
| LD |
 |
3,990 |
11.33% |
| Oth |
 |
801 |
2.27% |
| Maj |
 |
15,636 |
44.39% |
| Turn |
 |
35,227 |
51.84% |
|
|
 |
Jon Trickett
Labour hold
|
| L |
Jon Trickett |
23,036 |
65.39% |
| C |
Elizabeth Truss |
7,400 |
21.01% |
| SL |
Paul Turek |
801 |
2.27% |
| LD |
Ed Waller |
3,990 |
11.33% |
|
Candidates representing 4 parties stood for election to this seat.
|
|
 |
Jon Trickett
Labour
|
| Con |
 |
8,096 |
17.80% |
| Lab |
 |
32,088 |
70.56% |
| LD |
 |
4,033 |
8.87% |
| Ref |
 |
1,260 |
2.77% |
| Oth |
|
0 |
0.00% |
| Maj |
 |
23,992 |
52.76% |
| Turn |
 |
45,477 |
67.91% |
|
|
 |
|
Labour
|
| Con |
 |
13,428 |
25.80% |
| Lab |
 |
33,229 |
63.80% |
| LD |
 |
5,424 |
10.40% |
| Oth |
|
0 |
0.00% |
| Maj |
 |
19,801 |
38.00% |
| Turn |
 |
52,081 |
76.13% |
|
|
 |
|

|

