|
Hendon
Labour hold

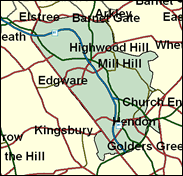
Labour re-affirmed their new-found lead in the newly united Barnet Borough seat of Hendon in the most recent London borough elections of May 1998, when they won Burnt Oak, Colindale, and West Hendon wards and outvoted the Tory candidates by fully eight per cent. They nearly matched the Conservatives fighting on weaker ground in the Euro-elections in 1999, and Andrew Dismore is probably the favourite to fend off the Opposition attempt to accomplish a six and a half per cent swing from 1997.

Andrew Dismore, a wire-rimmed-spectacled solicitor, a surprise Labour winner in 1997, cut his political teeth as part of the Labour minority on Westminster Council during the controversial Tory leadership of Dame Shirley Porter. An assiduous constituency MP with Greek Cypriot and Jewish minorities, he has sought legislation to ease religious restrictions on remarriage of Jewish women. He has also rebelled on air traffic control privatisation.
 |
| Wealthy Achievers, Suburban Areas |
26.65% |
14.99% |
177.76 |
|
| Affluent Greys, Rural Communities |
0.00% |
2.13% |
0.00 |
|
| Prosperous Pensioners, Retirement Areas |
4.01% |
2.49% |
161.16 |
|
| Affluent Executives, Family Areas |
2.22% |
4.43% |
50.09 |
|
| Well-Off Workers, Family Areas |
0.12% |
7.27% |
1.61 |
|
| Affluent Urbanites, Town & City Areas |
9.08% |
2.56% |
353.99 |
|
| Prosperous Professionals, Metropolitan Areas |
5.81% |
2.04% |
284.88 |
|
| Better-Off Executives, Inner City Areas |
2.63% |
3.94% |
66.73 |
|
| Comfortable Middle Agers, Mature Home Owning Areas |
7.49% |
13.04% |
57.42 |
|
| Skilled Workers, Home Owning Areas |
0.46% |
12.70% |
3.60 |
|
| New Home Owners, Mature Communities |
0.42% |
8.14% |
5.18 |
|
| White Collar Workers, Better-Off Multi Ethnic Areas |
20.71% |
4.02% |
514.84 |
|
| Older People, Less Prosperous Areas |
0.93% |
3.19% |
29.05 |
|
| Council Estate Residents, Better-Off Homes |
6.84% |
11.31% |
60.49 |
|
| Council Estate Residents, High Unemployment |
6.49% |
3.06% |
211.96 |
|
| Council Estate Residents, Greatest Hardship |
0.22% |
2.52% |
8.88 |
|
| People in Multi-Ethnic, Low-Income Areas |
5.89% |
2.10% |
280.53 |
|
| Unclassified |
0.04% |
0.06% |
63.37 |
|
|
 |
 |
 |
| £0-5K |
5.79% |
9.41% |
61.51 |
|
| £5-10K |
10.93% |
16.63% |
65.70 |
|
| £10-15K |
12.69% |
16.58% |
76.56 |
|
| £15-20K |
12.10% |
13.58% |
89.04 |
|
| £20-25K |
10.56% |
10.39% |
101.65 |
|
| £25-30K |
8.84% |
7.77% |
113.76 |
|
| £30-35K |
7.25% |
5.79% |
125.08 |
|
| £35-40K |
5.87% |
4.33% |
135.52 |
|
| £40-45K |
4.74% |
3.27% |
145.06 |
|
| £45-50K |
3.82% |
2.48% |
153.72 |
|
| £50-55K |
3.08% |
1.90% |
161.58 |
|
| £55-60K |
2.49% |
1.47% |
168.68 |
|
| £60-65K |
2.02% |
1.15% |
175.10 |
|
| £65-70K |
1.64% |
0.91% |
180.91 |
|
| £70-75K |
1.34% |
0.72% |
186.17 |
|
| £75-80K |
1.10% |
0.57% |
190.92 |
|
| £80-85K |
0.90% |
0.46% |
195.23 |
|
| £85-90K |
0.75% |
0.37% |
199.14 |
|
| £90-95K |
0.62% |
0.31% |
202.69 |
|
| £95-100K |
0.51% |
0.25% |
205.91 |
|
| £100K + |
2.95% |
1.34% |
219.26 |
|
|
|

|


|
1992-1997
|
1997-2001
|
|
|
|
| Con |
-16.57% |
| Lab |
15.83% |
| LD |
-0.85% |
|
| Con |
-2.72% |
| Lab |
3.13% |
| LD |
0.72% |
|
|
 |
Andrew Dismore
Labour hold
|
| Con |
 |
14,015 |
34.31% |
| Lab |
 |
21,432 |
52.46% |
| LD |
 |
4,724 |
11.56% |
| Oth |
 |
680 |
1.66% |
| Maj |
 |
7,417 |
18.16% |
| Turn |
 |
40,851 |
52.23% |
|
|
 |
Andrew Dismore
Labour hold
|
| LD |
Wayne Casey |
4,724 |
11.56% |
| UK |
Craig Crosbie |
409 |
1.00% |
| L |
Andrew Dismore |
21,432 |
52.46% |
| C |
Richard Evans |
14,015 |
34.31% |
| PD |
Michael Stewart |
107 |
0.26% |
| WRP |
Stella Taylor |
164 |
0.40% |
|
Candidates representing 6 parties stood for election to this seat.
|
|
 |
Andrew Dismore
Labour gain
|
| Con |
 |
18,528 |
37.03% |
| Lab |
 |
24,683 |
49.33% |
| LD |
 |
5,427 |
10.85% |
| Ref |
 |
978 |
1.95% |
| Oth |
 |
420 |
0.84% |
| Maj |
 |
6,155 |
12.30% |
| Turn |
 |
50,036 |
65.67% |
|
|
 |
|
Conservative
|
| Con |
 |
28,916 |
53.60% |
| Lab |
 |
18,068 |
33.50% |
| LD |
 |
6,289 |
11.70% |
| Oth |
 |
645 |
1.20% |
| Maj |
 |
10,848 |
20.10% |
| Turn |
 |
53,918 |
74.28% |
|
|
 |
|

|

