|
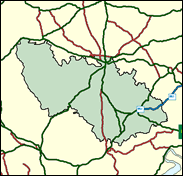
Hereford
Liberal Democrat hold

Providing the debate in the next General Election campaign does not centre on Europe (the Conservatives were well ahead here in the Euro-elections in 1999) the Liberal Democrats' Paul Keetch should retain this 1997 gain, with his strength based on the Lib Dems' long-term local dominance of the city of Hereford, although it is now subsumed in the new unitary authority of Herefordshire, revived in time for all-out elections in May 2000.

Paul Keetch, victor here in 1997, is in the Liberal tradition of local boy made good - born (1961) in Hereford, educated at Hereford High School and Sixth Form College, a former local councillor, with an ear close to the ground as an ex-PR man, defending Hereford cattle farmers and voting conservatively on hunting, and a Defence spokesman by 2000, reflecting the importance of the local presence of the SAS HQ. A classic Liberal Democrat professional politician, right down to the statement that for him "cider has always been a passion".
 |
| Wealthy Achievers, Suburban Areas |
15.58% |
14.99% |
103.92 |
|
| Affluent Greys, Rural Communities |
10.16% |
2.13% |
477.66 |
|
| Prosperous Pensioners, Retirement Areas |
1.87% |
2.49% |
75.34 |
|
| Affluent Executives, Family Areas |
4.28% |
4.43% |
96.74 |
|
| Well-Off Workers, Family Areas |
4.45% |
7.27% |
61.16 |
|
| Affluent Urbanites, Town & City Areas |
0.91% |
2.56% |
35.41 |
|
| Prosperous Professionals, Metropolitan Areas |
0.00% |
2.04% |
0.00 |
|
| Better-Off Executives, Inner City Areas |
2.84% |
3.94% |
72.12 |
|
| Comfortable Middle Agers, Mature Home Owning Areas |
15.62% |
13.04% |
119.81 |
|
| Skilled Workers, Home Owning Areas |
8.66% |
12.70% |
68.15 |
|
| New Home Owners, Mature Communities |
9.64% |
8.14% |
118.38 |
|
| White Collar Workers, Better-Off Multi Ethnic Areas |
4.30% |
4.02% |
106.88 |
|
| Older People, Less Prosperous Areas |
3.38% |
3.19% |
106.12 |
|
| Council Estate Residents, Better-Off Homes |
16.70% |
11.31% |
147.61 |
|
| Council Estate Residents, High Unemployment |
1.35% |
3.06% |
44.01 |
|
| Council Estate Residents, Greatest Hardship |
0.19% |
2.52% |
7.49 |
|
| People in Multi-Ethnic, Low-Income Areas |
0.00% |
2.10% |
0.00 |
|
| Unclassified |
0.08% |
0.06% |
125.54 |
|
|
 |
 |
 |
| £0-5K |
9.98% |
9.41% |
106.05 |
|
| £5-10K |
18.96% |
16.63% |
113.97 |
|
| £10-15K |
18.59% |
16.58% |
112.16 |
|
| £15-20K |
14.54% |
13.58% |
107.06 |
|
| £20-25K |
10.52% |
10.39% |
101.17 |
|
| £25-30K |
7.42% |
7.77% |
95.44 |
|
| £30-35K |
5.23% |
5.79% |
90.21 |
|
| £35-40K |
3.71% |
4.33% |
85.55 |
|
| £40-45K |
2.66% |
3.27% |
81.45 |
|
| £45-50K |
1.93% |
2.48% |
77.85 |
|
| £50-55K |
1.42% |
1.90% |
74.68 |
|
| £55-60K |
1.06% |
1.47% |
71.90 |
|
| £60-65K |
0.80% |
1.15% |
69.43 |
|
| £65-70K |
0.61% |
0.91% |
67.24 |
|
| £70-75K |
0.47% |
0.72% |
65.28 |
|
| £75-80K |
0.37% |
0.57% |
63.53 |
|
| £80-85K |
0.29% |
0.46% |
61.94 |
|
| £85-90K |
0.23% |
0.37% |
60.50 |
|
| £90-95K |
0.18% |
0.31% |
59.19 |
|
| £95-100K |
0.14% |
0.25% |
58.00 |
|
| £100K + |
0.70% |
1.34% |
52.37 |
|
|
|

|


|
1992-1997
|
1997-2001
|
|
|
|
| Con |
-11.70% |
| Lab |
1.95% |
| LD |
6.65% |
|
| Con |
3.43% |
| Lab |
2.56% |
| LD |
-7.09% |
|
|
 |
Paul Keetch
Liberal Democrat hold
|
| Con |
 |
17,276 |
38.73% |
| Lab |
 |
6,739 |
15.11% |
| LD |
 |
18,224 |
40.86% |
| Oth |
 |
2,365 |
5.30% |
| Maj |
 |
948 |
2.13% |
| Turn |
 |
44,604 |
63.44% |
|
|
 |
Paul Keetch
Liberal Democrat hold
|
| UK |
Clive Easton |
1,184 |
2.65% |
| G |
David Gillet |
1,181 |
2.65% |
| L |
David Hallam |
6,739 |
15.11% |
| LD |
Paul Keetch |
18,224 |
40.86% |
| C |
Virginia Taylor |
17,276 |
38.73% |
|
Candidates representing 5 parties stood for election to this seat.
|
|
 |
Paul Keetch
Liberal Democrat gain
|
| Con |
 |
18,550 |
35.30% |
| Lab |
 |
6,596 |
12.55% |
| LD |
 |
25,198 |
47.95% |
| Ref |
 |
2,209 |
4.20% |
| Oth |
|
0 |
0.00% |
| Maj |
 |
6,648 |
12.65% |
| Turn |
 |
52,553 |
75.22% |
|
|
 |
|
Conservative
|
| Con |
 |
26,217 |
47.00% |
| Lab |
 |
5,910 |
10.60% |
| LD |
 |
23,063 |
41.30% |
| Oth |
 |
587 |
1.10% |
| Maj |
 |
3,154 |
5.70% |
| Turn |
 |
55,777 |
80.77% |
|
|
 |
|

|

