|
Hertford & Stortford
Conservative hold

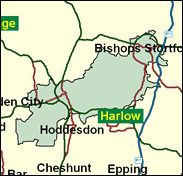
Whereas other county towns like Bedford, Cambridge, Norwich and Northampton are now firmly in Labour hands, Hertford reamins at the heart of a solidly Conservative seat. Why? Partly the explanation lies in the relatively small size of Hertford itself, which with a population of 22,000 contributes only a fraction of the voters to this constituency. Bishop's Stortford is bigger (28,000), and Ware is also a medium sized town (17,000). In addition there are a large number of villages in the flat but pleasant east Hertfordshire countryside. The seat is not made up of industrial or working-class territory, but dominated by prosperous market towns which have developed as favoured office, service and residential centres. Labour advanced into second place in 1997, but remained nearly 7,000 votes behind the retiring Tory, Bowen Wells.

For Mark Prisk, the new Conservative candidate, it should be third time lucky, after his failed bid for the Commons in two other seats in 1992 and 1997. A chartered surveyor who runs his own PR firm, he was born 1962 and educated at Truro School and Reading University (where he read land management). He is joint national co-ordinator of the Conservative Countryside Campaign, leading local campaigns in target seats on greenbelt, farming and rural issues. As a student he set up 'Youth for Peace through Nato' as part of the Tory response to the Greenham Women. Churchy, he sings in Stanmore Choral Society, is a sidesman at St. Peter's Church, Bushey Heath, and recently played the part of King Herod in Jesus Christ Superstar.
 |
| Wealthy Achievers, Suburban Areas |
28.64% |
14.99% |
191.04 |
|
| Affluent Greys, Rural Communities |
0.00% |
2.13% |
0.14 |
|
| Prosperous Pensioners, Retirement Areas |
1.63% |
2.49% |
65.62 |
|
| Affluent Executives, Family Areas |
16.43% |
4.43% |
371.21 |
|
| Well-Off Workers, Family Areas |
12.53% |
7.27% |
172.21 |
|
| Affluent Urbanites, Town & City Areas |
6.27% |
2.56% |
244.48 |
|
| Prosperous Professionals, Metropolitan Areas |
2.32% |
2.04% |
113.66 |
|
| Better-Off Executives, Inner City Areas |
0.12% |
3.94% |
2.92 |
|
| Comfortable Middle Agers, Mature Home Owning Areas |
10.96% |
13.04% |
84.08 |
|
| Skilled Workers, Home Owning Areas |
3.34% |
12.70% |
26.30 |
|
| New Home Owners, Mature Communities |
8.16% |
8.14% |
100.17 |
|
| White Collar Workers, Better-Off Multi Ethnic Areas |
2.10% |
4.02% |
52.20 |
|
| Older People, Less Prosperous Areas |
1.64% |
3.19% |
51.43 |
|
| Council Estate Residents, Better-Off Homes |
5.51% |
11.31% |
48.72 |
|
| Council Estate Residents, High Unemployment |
0.35% |
3.06% |
11.58 |
|
| Council Estate Residents, Greatest Hardship |
0.00% |
2.52% |
0.00 |
|
| People in Multi-Ethnic, Low-Income Areas |
0.00% |
2.10% |
0.00 |
|
| Unclassified |
0.00% |
0.06% |
0.00 |
|
|
 |
 |
 |
| £0-5K |
4.52% |
9.41% |
48.04 |
|
| £5-10K |
9.74% |
16.63% |
58.58 |
|
| £10-15K |
12.02% |
16.58% |
72.50 |
|
| £15-20K |
11.88% |
13.58% |
87.49 |
|
| £20-25K |
10.65% |
10.39% |
102.42 |
|
| £25-30K |
9.08% |
7.77% |
116.73 |
|
| £30-35K |
7.54% |
5.79% |
130.14 |
|
| £35-40K |
6.18% |
4.33% |
142.53 |
|
| £40-45K |
5.02% |
3.27% |
153.90 |
|
| £45-50K |
4.08% |
2.48% |
164.27 |
|
| £50-55K |
3.31% |
1.90% |
173.72 |
|
| £55-60K |
2.69% |
1.47% |
182.31 |
|
| £60-65K |
2.19% |
1.15% |
190.14 |
|
| £65-70K |
1.79% |
0.91% |
197.27 |
|
| £70-75K |
1.47% |
0.72% |
203.77 |
|
| £75-80K |
1.21% |
0.57% |
209.70 |
|
| £80-85K |
1.00% |
0.46% |
215.14 |
|
| £85-90K |
0.82% |
0.37% |
220.12 |
|
| £90-95K |
0.69% |
0.31% |
224.70 |
|
| £95-100K |
0.57% |
0.25% |
228.91 |
|
| £100K + |
3.34% |
1.34% |
248.14 |
|
|
|

|


|
1992-1997
|
1997-2001
|
|
|
|
| Con |
-12.46% |
| Lab |
14.52% |
| LD |
-7.76% |
|
| Con |
0.63% |
| Lab |
1.38% |
| LD |
2.16% |
|
|
 |
Mark Prisk
Conservative hold
|
| Con |
 |
21,074 |
44.67% |
| Lab |
 |
15,471 |
32.79% |
| LD |
 |
9,388 |
19.90% |
| Oth |
 |
1,243 |
2.63% |
| Maj |
 |
5,603 |
11.88% |
| Turn |
 |
47,176 |
62.78% |
|
|
 |
Mark Prisk
Conservative hold
|
| LD |
Mione Goldspink |
9,388 |
19.90% |
| C |
Mark Prisk |
21,074 |
44.67% |
| UK |
Stuart Rising |
1,243 |
2.63% |
| L |
Simon Speller |
15,471 |
32.79% |
|
Candidates representing 4 parties stood for election to this seat.
|
|
 |
Bowen Wells
Conservative
|
| Con |
 |
24,027 |
44.04% |
| Lab |
 |
17,142 |
31.42% |
| LD |
 |
9,679 |
17.74% |
| Ref |
 |
2,105 |
3.86% |
| Oth |
 |
1,608 |
2.95% |
| Maj |
 |
6,885 |
12.62% |
| Turn |
 |
54,561 |
76.03% |
|
|
 |
|
Conservative
|
| Con |
 |
31,942 |
56.50% |
| Lab |
 |
9,529 |
16.90% |
| LD |
 |
14,408 |
25.50% |
| Oth |
 |
660 |
1.20% |
| Maj |
 |
17,534 |
31.00% |
| Turn |
 |
56,539 |
80.11% |
|
|
 |
|

|

