|
Hertsmere
Conservative hold

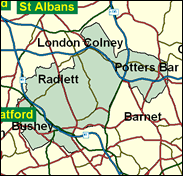
The communities of Potters Bar, Borehamwood, Elstree, Bushey and Radlett in south Hertfordshire form the constituency of Hertsmere, once represented by Cecil Parkinson, but held for the last nine years by James Clappison. The Conservative majority over Labour was only 3,000 in the 1997 General Election, after the gap was closed by a mighty 30 per cent, from 36 per cent to 6 per cent, but this trend cannot continue, surely, although it is equally unlikely that it will be fully reversed, in one step at least. Labour can rely in a more even year only on the post-war London County Council overspill estate of Borehamwood, around the ITV studios on the old film production site known as Elstree (although Elstree village is a different matter and votes Conservative). Second place looks like the best they can hope for in Hertsmere.

James Clappison, elected here in 1992 and a man for all orthodoxies, adhered to the Thatcherite agenda in the 1980s, then bowled stooge questions at ministers in the Major government before joining it for the last two years. He sought to eject anti-Maastricht rightwingers from the 1922 Committee, and now serves Hague (for whom he voted) as No. 4 in the Treasury team. A pudgy-faced, boyish-looking son of a rich farmer, he was born in 1956, and educated at St. Peter's School, York and Queen's College, Oxford. Residually Yorkshire-accented, he assiduously nurses his vulnerable-looking constituency whose Jewish minority warms to his Zionism. Labour's Hilary Broderick was born in 1943, educated at St Edmund's College, Liverpool and Kent University, and trained as a teacher at London and Cambridge.
 |
| Wealthy Achievers, Suburban Areas |
33.30% |
14.99% |
222.10 |
|
| Affluent Greys, Rural Communities |
0.00% |
2.13% |
0.00 |
|
| Prosperous Pensioners, Retirement Areas |
2.67% |
2.49% |
107.53 |
|
| Affluent Executives, Family Areas |
0.85% |
4.43% |
19.11 |
|
| Well-Off Workers, Family Areas |
4.91% |
7.27% |
67.47 |
|
| Affluent Urbanites, Town & City Areas |
4.21% |
2.56% |
164.31 |
|
| Prosperous Professionals, Metropolitan Areas |
2.66% |
2.04% |
130.43 |
|
| Better-Off Executives, Inner City Areas |
0.18% |
3.94% |
4.52 |
|
| Comfortable Middle Agers, Mature Home Owning Areas |
19.73% |
13.04% |
151.34 |
|
| Skilled Workers, Home Owning Areas |
6.22% |
12.70% |
48.96 |
|
| New Home Owners, Mature Communities |
10.16% |
8.14% |
124.73 |
|
| White Collar Workers, Better-Off Multi Ethnic Areas |
3.80% |
4.02% |
94.42 |
|
| Older People, Less Prosperous Areas |
2.31% |
3.19% |
72.51 |
|
| Council Estate Residents, Better-Off Homes |
7.42% |
11.31% |
65.59 |
|
| Council Estate Residents, High Unemployment |
1.17% |
3.06% |
38.13 |
|
| Council Estate Residents, Greatest Hardship |
0.00% |
2.52% |
0.00 |
|
| People in Multi-Ethnic, Low-Income Areas |
0.00% |
2.10% |
0.00 |
|
| Unclassified |
0.42% |
0.06% |
666.81 |
|
|
 |
 |
 |
| £0-5K |
5.27% |
9.41% |
55.99 |
|
| £5-10K |
10.65% |
16.63% |
64.01 |
|
| £10-15K |
12.57% |
16.58% |
75.83 |
|
| £15-20K |
12.05% |
13.58% |
88.72 |
|
| £20-25K |
10.56% |
10.39% |
101.62 |
|
| £25-30K |
8.87% |
7.77% |
114.04 |
|
| £30-35K |
7.28% |
5.79% |
125.77 |
|
| £35-40K |
5.92% |
4.33% |
136.71 |
|
| £40-45K |
4.79% |
3.27% |
146.84 |
|
| £45-50K |
3.88% |
2.48% |
156.18 |
|
| £50-55K |
3.14% |
1.90% |
164.77 |
|
| £55-60K |
2.55% |
1.47% |
172.66 |
|
| £60-65K |
2.07% |
1.15% |
179.91 |
|
| £65-70K |
1.69% |
0.91% |
186.55 |
|
| £70-75K |
1.39% |
0.72% |
192.65 |
|
| £75-80K |
1.14% |
0.57% |
198.25 |
|
| £80-85K |
0.94% |
0.46% |
203.39 |
|
| £85-90K |
0.78% |
0.37% |
208.12 |
|
| £90-95K |
0.65% |
0.31% |
212.46 |
|
| £95-100K |
0.54% |
0.25% |
216.45 |
|
| £100K + |
3.14% |
1.34% |
233.63 |
|
|
|

|


|
1992-1997
|
1997-2001
|
|
|
|
| Con |
-13.50% |
| Lab |
16.39% |
| LD |
-6.86% |
|
| Con |
3.54% |
| Lab |
-2.17% |
| LD |
2.34% |
|
|
 |
James Clappison
Conservative hold
|
| Con |
 |
19,855 |
47.84% |
| Lab |
 |
14,953 |
36.03% |
| LD |
 |
6,300 |
15.18% |
| Oth |
 |
397 |
0.96% |
| Maj |
 |
4,902 |
11.81% |
| Turn |
 |
41,505 |
60.34% |
|
|
 |
James Clappison
Conservative hold
|
| L |
Hilary Broderick |
14,953 |
36.03% |
| C |
James Clappison |
19,855 |
47.84% |
| SL |
James Dry |
397 |
0.96% |
| LD |
Paul Thompson |
6,300 |
15.18% |
|
Candidates representing 4 parties stood for election to this seat.
|
|
 |
James Clappison
Conservative
|
| Con |
 |
22,305 |
44.30% |
| Lab |
 |
19,230 |
38.19% |
| LD |
 |
6,466 |
12.84% |
| Ref |
 |
1,703 |
3.38% |
| Oth |
 |
644 |
1.28% |
| Maj |
 |
3,075 |
6.11% |
| Turn |
 |
50,348 |
74.03% |
|
|
 |
|
Conservative
|
| Con |
 |
30,439 |
57.80% |
| Lab |
 |
11,473 |
21.80% |
| LD |
 |
10,364 |
19.70% |
| Oth |
 |
347 |
0.70% |
| Maj |
 |
18,966 |
36.00% |
| Turn |
 |
52,623 |
79.64% |
|
|
 |
|

|

