|
Hexham
Conservative hold

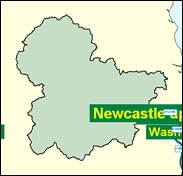
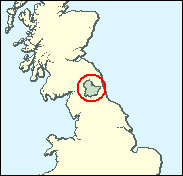
Hexham has two distinctly contrasting features. First, it is the second largest seat in area in England, after Penrith and the Border, sprawling across 250,992 hectares, stretching from south of the river Tyne to the Scottish border, and including the vast forests of Wark and Kielder, as well as the most substantial section of Hadrian's Wall. It covers most of Northumberland. As all this implies, it is heavily skewed to rural employment, not least forestry, with attractive small towns in the Tyne valley such as Hexham itself and Corbridge. Labour's only traditional centre of support is the more industrial town of Prudhoe nearer to Newcastyle, but the seat also includes one of the very best and most expensive neighbourhoods which serve as residential bases for the Geordie city, Darras Hall near Ponteland. Yet the second interesting feature is that this was held by the Conservatives by only 222 votes in 1997, making it their fourth most vulnerable seat and the third on any list of further Labour gains. This shows two things: the true extent of the Labour advance throughout Britain in 1997, and the weakness of the Conservative Party in the North of England, even in a seat which seems designed for them.

Peter Atkinson, on grounds of geographical proximity alone, is the Conservative Whip on Scottish Affairs. Elected here in 1992, he is a journalist-turned-PR man for countryside interests - in his case the British Field Sports Society, and so, predictably, a leading opponent of gun control and anti-hunting legislation. Born 1943 and educated at Cheltenham College, he learnt his free-market Toryism on Wandsworth Council. Labour's Paul Brannen works in political PR (formerly with Sarah Macaulay's company). He was born in 1962, educated at Walbottle High School, Newcastle and Leeds University, and fought Berwick upon Tweed in 1997.
 |
| Wealthy Achievers, Suburban Areas |
28.20% |
14.99% |
188.10 |
|
| Affluent Greys, Rural Communities |
12.44% |
2.13% |
584.99 |
|
| Prosperous Pensioners, Retirement Areas |
1.54% |
2.49% |
61.75 |
|
| Affluent Executives, Family Areas |
3.33% |
4.43% |
75.26 |
|
| Well-Off Workers, Family Areas |
3.39% |
7.27% |
46.60 |
|
| Affluent Urbanites, Town & City Areas |
2.56% |
2.56% |
99.92 |
|
| Prosperous Professionals, Metropolitan Areas |
0.11% |
2.04% |
5.43 |
|
| Better-Off Executives, Inner City Areas |
0.87% |
3.94% |
22.17 |
|
| Comfortable Middle Agers, Mature Home Owning Areas |
17.11% |
13.04% |
131.25 |
|
| Skilled Workers, Home Owning Areas |
7.43% |
12.70% |
58.48 |
|
| New Home Owners, Mature Communities |
12.50% |
8.14% |
153.53 |
|
| White Collar Workers, Better-Off Multi Ethnic Areas |
1.67% |
4.02% |
41.42 |
|
| Older People, Less Prosperous Areas |
3.49% |
3.19% |
109.47 |
|
| Council Estate Residents, Better-Off Homes |
5.20% |
11.31% |
45.97 |
|
| Council Estate Residents, High Unemployment |
0.10% |
3.06% |
3.19 |
|
| Council Estate Residents, Greatest Hardship |
0.03% |
2.52% |
1.20 |
|
| People in Multi-Ethnic, Low-Income Areas |
0.00% |
2.10% |
0.00 |
|
| Unclassified |
0.03% |
0.06% |
52.89 |
|
|
 |
 |
 |
| £0-5K |
6.44% |
9.41% |
68.46 |
|
| £5-10K |
13.57% |
16.63% |
81.58 |
|
| £10-15K |
15.05% |
16.58% |
90.75 |
|
| £15-20K |
13.34% |
13.58% |
98.24 |
|
| £20-25K |
10.88% |
10.39% |
104.66 |
|
| £25-30K |
8.57% |
7.77% |
110.27 |
|
| £30-35K |
6.67% |
5.79% |
115.22 |
|
| £35-40K |
5.18% |
4.33% |
119.58 |
|
| £40-45K |
4.03% |
3.27% |
123.44 |
|
| £45-50K |
3.15% |
2.48% |
126.86 |
|
| £50-55K |
2.47% |
1.90% |
129.88 |
|
| £55-60K |
1.95% |
1.47% |
132.56 |
|
| £60-65K |
1.55% |
1.15% |
134.93 |
|
| £65-70K |
1.24% |
0.91% |
137.03 |
|
| £70-75K |
1.00% |
0.72% |
138.89 |
|
| £75-80K |
0.81% |
0.57% |
140.54 |
|
| £80-85K |
0.66% |
0.46% |
142.01 |
|
| £85-90K |
0.54% |
0.37% |
143.31 |
|
| £90-95K |
0.44% |
0.31% |
144.46 |
|
| £95-100K |
0.36% |
0.25% |
145.49 |
|
| £100K + |
2.00% |
1.34% |
148.99 |
|
|
|

|


|
1992-1997
|
1997-2001
|
|
|
|
| Con |
-13.64% |
| Lab |
14.07% |
| LD |
-4.27% |
|
| Con |
5.84% |
| Lab |
0.37% |
| LD |
-2.38% |
|
|
 |
Peter Atkinson
Conservative hold
|
| Con |
 |
18,917 |
44.60% |
| Lab |
 |
16,388 |
38.64% |
| LD |
 |
6,380 |
15.04% |
| Oth |
 |
728 |
1.72% |
| Maj |
 |
2,529 |
5.96% |
| Turn |
 |
42,413 |
70.92% |
|
|
 |
Peter Atkinson
Conservative hold
|
| C |
Peter Atkinson |
18,917 |
44.60% |
| L |
Paul Branned |
16,388 |
38.64% |
| LD |
Philip Latham |
6,380 |
15.04% |
| UK |
Alan Patterson |
728 |
1.72% |
|
Candidates representing 4 parties stood for election to this seat.
|
|
 |
Peter Atkinson
Conservative
|
| Con |
 |
17,701 |
38.76% |
| Lab |
 |
17,479 |
38.27% |
| LD |
 |
7,959 |
17.43% |
| Ref |
 |
1,362 |
2.98% |
| Oth |
 |
1,170 |
2.56% |
| Maj |
 |
222 |
0.49% |
| Turn |
 |
45,671 |
77.52% |
|
|
 |
|
Conservative
|
| Con |
 |
24,967 |
52.40% |
| Lab |
 |
11,529 |
24.20% |
| LD |
 |
10,344 |
21.70% |
| Oth |
 |
781 |
1.60% |
| Maj |
 |
13,438 |
28.20% |
| Turn |
 |
47,621 |
82.05% |
|
|
 |
|

|

