|
Heywood & Middleton
Labour hold

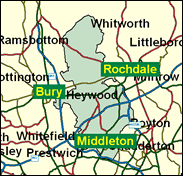
There are very middle class and Conservative sections in this Lancashire / northern Greater Manchester constituency. It has always included Middleton South ward, which includes Alkrington Garden Village, where you can see the comic Bernard Manning's limousine outside the house he has lived in for many years. In the 1997 boundary changes there arrived the main middle class area of Rochdale, Norden and Bamford ward, which had previously voted tactically for the Liberals against Labour in the seat held for 25 years by Cyril Smith and Liz Lynne. But these are outvoted by the large council estates of west and central Middleton (principally Langley) and west Heywood, whose tower blocks can be seen from the M66 motorway as it travels south from the Rossendale valley towards Manchester. After a standard (i.e. huge) swing in 1997 Labour's Jim Dobbin held the seat with a record 17,500 majority.

Jim Dobbin, Labour's man here since 1997, has about him the dishevelled shaggily-bearded aspect of a gentleman of the road, when in fact he is an NHS microbiologist of 33-years standing, born 1941, educated at Roman Catholic high schools in Kirkcaldy, and at Napier College, Edinburgh. He was one of the few of the 1997 intake to vote against lone parent benefit cuts, and has subsequently broken ranks on pensions, means testing of incapacity benefit, and air traffic control privatisation. As a former Rochdale councillor, he is antipathetic to the locally-active Liberal Democrats. He has backed the appointment of an Ex-Servicemen's Minister.
 |
| Wealthy Achievers, Suburban Areas |
11.62% |
14.99% |
77.52 |
|
| Affluent Greys, Rural Communities |
0.13% |
2.13% |
6.19 |
|
| Prosperous Pensioners, Retirement Areas |
0.03% |
2.49% |
1.36 |
|
| Affluent Executives, Family Areas |
5.43% |
4.43% |
122.75 |
|
| Well-Off Workers, Family Areas |
9.80% |
7.27% |
134.73 |
|
| Affluent Urbanites, Town & City Areas |
0.25% |
2.56% |
9.84 |
|
| Prosperous Professionals, Metropolitan Areas |
0.00% |
2.04% |
0.00 |
|
| Better-Off Executives, Inner City Areas |
0.21% |
3.94% |
5.21 |
|
| Comfortable Middle Agers, Mature Home Owning Areas |
7.47% |
13.04% |
57.32 |
|
| Skilled Workers, Home Owning Areas |
24.82% |
12.70% |
195.41 |
|
| New Home Owners, Mature Communities |
6.33% |
8.14% |
77.79 |
|
| White Collar Workers, Better-Off Multi Ethnic Areas |
0.93% |
4.02% |
23.02 |
|
| Older People, Less Prosperous Areas |
4.68% |
3.19% |
147.01 |
|
| Council Estate Residents, Better-Off Homes |
20.49% |
11.31% |
181.16 |
|
| Council Estate Residents, High Unemployment |
2.57% |
3.06% |
83.91 |
|
| Council Estate Residents, Greatest Hardship |
5.22% |
2.52% |
207.36 |
|
| People in Multi-Ethnic, Low-Income Areas |
0.00% |
2.10% |
0.00 |
|
| Unclassified |
0.00% |
0.06% |
0.00 |
|
|
 |
 |
 |
| £0-5K |
10.89% |
9.41% |
115.70 |
|
| £5-10K |
18.62% |
16.63% |
111.94 |
|
| £10-15K |
17.77% |
16.58% |
107.17 |
|
| £15-20K |
13.92% |
13.58% |
102.49 |
|
| £20-25K |
10.21% |
10.39% |
98.24 |
|
| £25-30K |
7.35% |
7.77% |
94.49 |
|
| £30-35K |
5.28% |
5.79% |
91.19 |
|
| £35-40K |
3.82% |
4.33% |
88.28 |
|
| £40-45K |
2.80% |
3.27% |
85.70 |
|
| £45-50K |
2.07% |
2.48% |
83.39 |
|
| £50-55K |
1.55% |
1.90% |
81.30 |
|
| £55-60K |
1.17% |
1.47% |
79.39 |
|
| £60-65K |
0.89% |
1.15% |
77.64 |
|
| £65-70K |
0.69% |
0.91% |
76.01 |
|
| £70-75K |
0.54% |
0.72% |
74.50 |
|
| £75-80K |
0.42% |
0.57% |
73.09 |
|
| £80-85K |
0.33% |
0.46% |
71.76 |
|
| £85-90K |
0.26% |
0.37% |
70.50 |
|
| £90-95K |
0.21% |
0.31% |
69.31 |
|
| £95-100K |
0.17% |
0.25% |
68.18 |
|
| £100K + |
0.83% |
1.34% |
61.76 |
|
|
|

|


|
1992-1997
|
1997-2001
|
|
|
|
| Con |
-8.58% |
| Lab |
11.22% |
| LD |
-4.36% |
|
| Con |
4.59% |
| Lab |
-0.02% |
| LD |
-4.48% |
|
|
 |
Jim Dobbin
Labour hold
|
| Con |
 |
10,707 |
27.61% |
| Lab |
 |
22,377 |
57.70% |
| LD |
 |
4,329 |
11.16% |
| Oth |
 |
1,366 |
3.52% |
| Maj |
 |
11,670 |
30.09% |
| Turn |
 |
38,779 |
53.12% |
|
|
 |
Jim Dobbin
Labour hold
|
| LIB |
Philip Burke |
1,021 |
2.63% |
| LC |
Jim Dobbin |
22,377 |
57.70% |
| LD |
Ian Greenhalgh |
4,329 |
11.16% |
| C |
Marilyn Hopkins |
10,707 |
27.61% |
| CD |
Christine West |
345 |
0.89% |
|
Candidates representing 5 parties stood for election to this seat.
|
|
 |
Jim Dobbin
Labour
|
| Con |
 |
11,637 |
23.02% |
| Lab |
 |
29,179 |
57.72% |
| LD |
 |
7,908 |
15.64% |
| Ref |
 |
1,076 |
2.13% |
| Oth |
 |
750 |
1.48% |
| Maj |
 |
17,542 |
34.70% |
| Turn |
 |
50,550 |
68.41% |
|
|
 |
|
Labour
|
| Con |
 |
17,591 |
31.60% |
| Lab |
 |
25,885 |
46.50% |
| LD |
 |
11,119 |
20.00% |
| Oth |
 |
1,093 |
2.00% |
| Maj |
 |
8,294 |
14.90% |
| Turn |
 |
55,688 |
74.49% |
|
|
 |
|

|

