|
High Peak
Labour hold

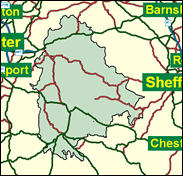
Labour only wins the Derbyshire part of the High Peak in an exceptional landslide year, like 1966 and 1997. This pattern is likely to continue; but then, another landslide seems a reasonable prospect at the time of updating. High Peak sounds very pretty, and in fact it does contain some douce scenery around the Ladybower reservoirs and the Hope Valley, but its population is concentrated in five towns: Whaley Bridge and Chapel en le Frith, which are within the orbit of Manchester commuting; the more industrial New Mills, which looks like a Pennine textile town from further north; Glossop, which is further north, almost due east of Manchester and as far removed in appearance and spirit from Derby as anywhere technically in the county; and Buxton, which is famous as a spa town. Buxton does indeed have the splendid wooded residential areas and quality housing one might expect of a place where Victorians took the waters, but it is also a centre of the limestone quarrying industry and has a very solid Labour vote in its less glamorous neighbourhoods to the east (Fairfield) and south (Cote Heath and Harpur Hill). It is the highest town in England and has the independence of spirit to be expected from a place regularly cut off by the elements. The whole of the High Peak seat is individual. It is the only part of Derbyshire recognised officially by the Registrar General to be in the north west of England, and Heaven help an unwary outsider who places it in the East Midlands region.

Tom Levitt, a bald school teacher who won at his second attempt here for Labour in 1997, has had his loyalism repaid by the post of PPS to Barbara Roche. A long-running Labour candidate and councillor, he was born 1954 and educated at Westwood High School, Leek and at Lancaster University, and with his employment as a science teacher for 19 years, and his routinely orthodox advocacy of comprehensive schooling and his transition from soft-left to Blair-loyal, comes as a fairly standard issue Labour MP.
 |
| Wealthy Achievers, Suburban Areas |
14.61% |
14.99% |
97.41 |
|
| Affluent Greys, Rural Communities |
0.44% |
2.13% |
20.47 |
|
| Prosperous Pensioners, Retirement Areas |
1.68% |
2.49% |
67.52 |
|
| Affluent Executives, Family Areas |
3.66% |
4.43% |
82.72 |
|
| Well-Off Workers, Family Areas |
11.61% |
7.27% |
159.62 |
|
| Affluent Urbanites, Town & City Areas |
0.87% |
2.56% |
34.10 |
|
| Prosperous Professionals, Metropolitan Areas |
0.00% |
2.04% |
0.10 |
|
| Better-Off Executives, Inner City Areas |
1.19% |
3.94% |
30.28 |
|
| Comfortable Middle Agers, Mature Home Owning Areas |
13.94% |
13.04% |
106.94 |
|
| Skilled Workers, Home Owning Areas |
28.31% |
12.70% |
222.88 |
|
| New Home Owners, Mature Communities |
8.57% |
8.14% |
105.21 |
|
| White Collar Workers, Better-Off Multi Ethnic Areas |
4.42% |
4.02% |
109.94 |
|
| Older People, Less Prosperous Areas |
2.44% |
3.19% |
76.49 |
|
| Council Estate Residents, Better-Off Homes |
5.69% |
11.31% |
50.30 |
|
| Council Estate Residents, High Unemployment |
0.11% |
3.06% |
3.65 |
|
| Council Estate Residents, Greatest Hardship |
2.45% |
2.52% |
97.28 |
|
| People in Multi-Ethnic, Low-Income Areas |
0.00% |
2.10% |
0.00 |
|
| Unclassified |
0.01% |
0.06% |
11.61 |
|
|
 |
 |
 |
| £0-5K |
7.33% |
9.41% |
77.91 |
|
| £5-10K |
14.94% |
16.63% |
89.79 |
|
| £10-15K |
16.43% |
16.58% |
99.10 |
|
| £15-20K |
14.32% |
13.58% |
105.43 |
|
| £20-25K |
11.34% |
10.39% |
109.08 |
|
| £25-30K |
8.61% |
7.77% |
110.70 |
|
| £30-35K |
6.42% |
5.79% |
110.89 |
|
| £35-40K |
4.77% |
4.33% |
110.15 |
|
| £40-45K |
3.55% |
3.27% |
108.80 |
|
| £45-50K |
2.66% |
2.48% |
107.11 |
|
| £50-55K |
2.00% |
1.90% |
105.23 |
|
| £55-60K |
1.52% |
1.47% |
103.29 |
|
| £60-65K |
1.17% |
1.15% |
101.34 |
|
| £65-70K |
0.90% |
0.91% |
99.45 |
|
| £70-75K |
0.70% |
0.72% |
97.64 |
|
| £75-80K |
0.55% |
0.57% |
95.92 |
|
| £80-85K |
0.44% |
0.46% |
94.31 |
|
| £85-90K |
0.35% |
0.37% |
92.81 |
|
| £90-95K |
0.28% |
0.31% |
91.42 |
|
| £95-100K |
0.23% |
0.25% |
90.13 |
|
| £100K + |
1.14% |
1.34% |
84.80 |
|
|
|

|


|
1992-1997
|
1997-2001
|
|
|
|
| Con |
-10.55% |
| Lab |
12.93% |
| LD |
-3.57% |
|
| Con |
1.84% |
| Lab |
-4.21% |
| LD |
4.86% |
|
|
 |
Tom Levitt
Labour hold
|
| Con |
 |
17,941 |
37.29% |
| Lab |
 |
22,430 |
46.62% |
| LD |
 |
7,743 |
16.09% |
| Oth |
|
0 |
0.00% |
| Maj |
 |
4,489 |
9.33% |
| Turn |
 |
48,114 |
65.22% |
|
|
 |
Tom Levitt
Labour hold
|
| LD |
Peter Ashenden |
7,743 |
16.09% |
| C |
Simon Chapman |
17,941 |
37.29% |
| L |
Tom Levitt |
22,430 |
46.62% |
|
Candidates representing 3 parties stood for election to this seat.
|
|
 |
Tom Levitt
Labour gain
|
| Con |
 |
20,261 |
35.45% |
| Lab |
 |
29,052 |
50.83% |
| LD |
 |
6,420 |
11.23% |
| Ref |
 |
1,420 |
2.48% |
| Oth |
|
0 |
0.00% |
| Maj |
 |
8,791 |
15.38% |
| Turn |
 |
57,153 |
79.03% |
|
|
 |
|
Conservative
|
| Con |
 |
27,535 |
46.00% |
| Lab |
 |
22,717 |
37.90% |
| LD |
 |
8,860 |
14.80% |
| Oth |
 |
794 |
1.30% |
| Maj |
 |
4,818 |
8.00% |
| Turn |
 |
59,906 |
84.13% |
|
|
 |
|

|

