|
Hitchin & Harpenden
Conservative hold

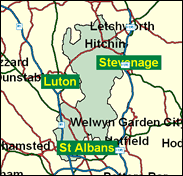
A decidedly odd pairing created by the Boundary Commission's need to give Hertfordshire and eleventh seat in their 1995 report, this seat was thus first fought in 1997. Hitchin is a marginal town in north Hertfordshire, with a light industrial base, council housing in the Oughton ward and a substantial Asian minority in Bearton ward. Harpenden on the other hand looks to St Albans, with which it was paired from 1974 to 1997 (Hemel Hempstead before that), and had effectively kept those seats safely Conservative - as they are no longer, but as Hitchin and Harpenden is. Simply, Harpenden is one of the most middle class and Conservative towns in Britain, as was clear from small-area Census data before the mergers which came into effect in 1974. It has ultra-wealthy sections such as East Common and West Common, the long term home of the comedian Eric Morecambe, who publicised it in his routine as well as his adherence to Luton Football Club. It is clear that the Boundary Commission have difficulty placing Harpenden (they originally proposed last time to put it in with Hatfield), but although the present situation is unsatisfactory - Hitchin is 15 miles away on the other side of Luton - wherever it goes it will apparently make a decisive impact in the Conservative interest.

Peter Lilley, discarded policy strategist of the earlier part of Hague's leadership after being demoted from Shadow Chancellor, is a one-time Gradgrind Thatcherite who has latterly appeared to trim in a One Nation direction. His defenders, however, say he was never as he seemed, merely playing to a rightwing gallery. Cerebral and diffident, he was born 1943, attended Dulwich College and Clare College, Cambridge, and was an oil analyst and stockbroker before working in the Conservative Research Department for four years. With a deficiency in many of the usual political arts, he abortively ran for leader in 1997 and won the endorsement of 24 MPs out of 165. His ominous designation as 'Deputy Leader' in 1998 sounded the death knell.
 |
| Wealthy Achievers, Suburban Areas |
39.09% |
14.99% |
260.72 |
|
| Affluent Greys, Rural Communities |
0.16% |
2.13% |
7.49 |
|
| Prosperous Pensioners, Retirement Areas |
2.14% |
2.49% |
86.11 |
|
| Affluent Executives, Family Areas |
7.34% |
4.43% |
165.81 |
|
| Well-Off Workers, Family Areas |
4.65% |
7.27% |
63.88 |
|
| Affluent Urbanites, Town & City Areas |
5.53% |
2.56% |
215.81 |
|
| Prosperous Professionals, Metropolitan Areas |
2.51% |
2.04% |
122.93 |
|
| Better-Off Executives, Inner City Areas |
0.18% |
3.94% |
4.54 |
|
| Comfortable Middle Agers, Mature Home Owning Areas |
17.67% |
13.04% |
135.55 |
|
| Skilled Workers, Home Owning Areas |
3.37% |
12.70% |
26.55 |
|
| New Home Owners, Mature Communities |
6.93% |
8.14% |
85.11 |
|
| White Collar Workers, Better-Off Multi Ethnic Areas |
3.11% |
4.02% |
77.42 |
|
| Older People, Less Prosperous Areas |
0.92% |
3.19% |
28.88 |
|
| Council Estate Residents, Better-Off Homes |
5.87% |
11.31% |
51.89 |
|
| Council Estate Residents, High Unemployment |
0.51% |
3.06% |
16.62 |
|
| Council Estate Residents, Greatest Hardship |
0.00% |
2.52% |
0.00 |
|
| People in Multi-Ethnic, Low-Income Areas |
0.00% |
2.10% |
0.00 |
|
| Unclassified |
0.01% |
0.06% |
19.39 |
|
|
 |
 |
 |
| £0-5K |
5.61% |
9.41% |
59.64 |
|
| £5-10K |
10.49% |
16.63% |
63.06 |
|
| £10-15K |
12.13% |
16.58% |
73.16 |
|
| £15-20K |
11.61% |
13.58% |
85.47 |
|
| £20-25K |
10.24% |
10.39% |
98.52 |
|
| £25-30K |
8.68% |
7.77% |
111.63 |
|
| £30-35K |
7.21% |
5.79% |
124.42 |
|
| £35-40K |
5.92% |
4.33% |
136.69 |
|
| £40-45K |
4.84% |
3.27% |
148.33 |
|
| £45-50K |
3.95% |
2.48% |
159.31 |
|
| £50-55K |
3.23% |
1.90% |
169.62 |
|
| £55-60K |
2.64% |
1.47% |
179.28 |
|
| £60-65K |
2.17% |
1.15% |
188.32 |
|
| £65-70K |
1.78% |
0.91% |
196.77 |
|
| £70-75K |
1.47% |
0.72% |
204.68 |
|
| £75-80K |
1.22% |
0.57% |
212.09 |
|
| £80-85K |
1.01% |
0.46% |
219.04 |
|
| £85-90K |
0.84% |
0.37% |
225.56 |
|
| £90-95K |
0.71% |
0.31% |
231.69 |
|
| £95-100K |
0.59% |
0.25% |
237.45 |
|
| £100K + |
3.59% |
1.34% |
267.46 |
|
|
|

|


|
1992-1997
|
1997-2001
|
|
|
|
| Con |
-15.55% |
| Lab |
15.23% |
| LD |
0.26% |
|
| Con |
1.50% |
| Lab |
-0.61% |
| LD |
-2.08% |
|
|
 |
Peter Lilley
Conservative hold
|
| Con |
 |
21,271 |
47.35% |
| Lab |
 |
14,608 |
32.52% |
| LD |
 |
8,076 |
17.98% |
| Oth |
 |
969 |
2.16% |
| Maj |
 |
6,663 |
14.83% |
| Turn |
 |
44,924 |
66.86% |
|
|
 |
Peter Lilley
Conservative hold
|
| L |
Alan Amos |
14,608 |
32.52% |
| C |
Peter Lilley |
21,271 |
47.35% |
| LD |
John Murphy |
8,076 |
17.98% |
| I |
Peter Rigby |
363 |
0.81% |
| UK |
John Saunders |
606 |
1.35% |
|
Candidates representing 5 parties stood for election to this seat.
|
|
 |
Peter Lilley
Conservative
|
| Con |
 |
24,038 |
45.85% |
| Lab |
 |
17,367 |
33.13% |
| LD |
 |
10,515 |
20.06% |
| Ref |
|
0 |
0.00% |
| Oth |
 |
507 |
0.97% |
| Maj |
 |
6,671 |
12.72% |
| Turn |
 |
52,427 |
77.99% |
|
|
 |
|
Conservative
|
| Con |
 |
33,402 |
61.40% |
| Lab |
 |
9,711 |
17.90% |
| LD |
 |
10,766 |
19.80% |
| Oth |
 |
498 |
0.90% |
| Maj |
 |
22,636 |
41.60% |
| Turn |
 |
54,377 |
81.30% |
|
|
 |
|

|

