|
Holborn & St Pancras
Labour hold

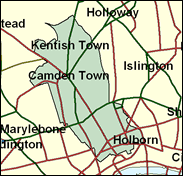
Frank Dobson may not be Mayor of London, having lost out to Ken Livingstone, but he is not forgotten in his own seat in the southern part of Camden London Borough, which stretches from Chalk Farm and Primrose Hill through Kentish Town and Camden Town and Somers Town into the heart of London at Holborn itself and Bloomsbury. This is far from chiefly working class residentially, but those enclaves of wealth and prosperity tend to be occupied by liberally minded voters, and this counts as a very safe Labour seat as long as Dobson wishes to continue in the Commons.

Frank Dobson, one of Blair's discarded Cabinet Ministers, and MP here since 1979, is a superficially cuddly, pugnacious, dirty-joke-telling Yorkshireman, and bearded Buster-Merryweather lookalike, who for three years as Health Secretary said the NHS was getting better until forced by Blair to quit in order to stand against Livingstone for Mayor of London and get slaughtered. Understandably now fallen into silence as he contemplates the likely prospect of the red benches in another place, he was born 1940, educated at Archbishop Holgate's Grammar School, York and LSE and worked as a civil servant for the CEGB, Electricity Council and Local Government Ombudsman, and ran Camden Council for a while in the 1970s.
 |
| Wealthy Achievers, Suburban Areas |
0.03% |
14.99% |
0.19 |
|
| Affluent Greys, Rural Communities |
0.00% |
2.13% |
0.05 |
|
| Prosperous Pensioners, Retirement Areas |
1.01% |
2.49% |
40.55 |
|
| Affluent Executives, Family Areas |
0.84% |
4.43% |
19.09 |
|
| Well-Off Workers, Family Areas |
0.00% |
7.27% |
0.00 |
|
| Affluent Urbanites, Town & City Areas |
1.73% |
2.56% |
67.62 |
|
| Prosperous Professionals, Metropolitan Areas |
7.35% |
2.04% |
360.25 |
|
| Better-Off Executives, Inner City Areas |
46.06% |
3.94% |
1,167.93 |
|
| Comfortable Middle Agers, Mature Home Owning Areas |
0.56% |
13.04% |
4.27 |
|
| Skilled Workers, Home Owning Areas |
0.00% |
12.70% |
0.00 |
|
| New Home Owners, Mature Communities |
0.01% |
8.14% |
0.06 |
|
| White Collar Workers, Better-Off Multi Ethnic Areas |
3.72% |
4.02% |
92.61 |
|
| Older People, Less Prosperous Areas |
0.00% |
3.19% |
0.00 |
|
| Council Estate Residents, Better-Off Homes |
0.00% |
11.31% |
0.00 |
|
| Council Estate Residents, High Unemployment |
19.61% |
3.06% |
640.30 |
|
| Council Estate Residents, Greatest Hardship |
0.00% |
2.52% |
0.16 |
|
| People in Multi-Ethnic, Low-Income Areas |
18.34% |
2.10% |
873.56 |
|
| Unclassified |
0.73% |
0.06% |
1,168.04 |
|
|
 |
 |
 |
| £0-5K |
5.65% |
9.41% |
59.99 |
|
| £5-10K |
11.06% |
16.63% |
66.49 |
|
| £10-15K |
12.75% |
16.58% |
76.93 |
|
| £15-20K |
11.99% |
13.58% |
88.30 |
|
| £20-25K |
10.35% |
10.39% |
99.62 |
|
| £25-30K |
8.59% |
7.77% |
110.53 |
|
| £30-35K |
7.00% |
5.79% |
120.88 |
|
| £35-40K |
5.66% |
4.33% |
130.66 |
|
| £40-45K |
4.57% |
3.27% |
139.88 |
|
| £45-50K |
3.69% |
2.48% |
148.57 |
|
| £50-55K |
2.99% |
1.90% |
156.79 |
|
| £55-60K |
2.43% |
1.47% |
164.59 |
|
| £60-65K |
1.98% |
1.15% |
172.00 |
|
| £65-70K |
1.62% |
0.91% |
179.07 |
|
| £70-75K |
1.34% |
0.72% |
185.83 |
|
| £75-80K |
1.11% |
0.57% |
192.31 |
|
| £80-85K |
0.92% |
0.46% |
198.54 |
|
| £85-90K |
0.77% |
0.37% |
204.55 |
|
| £90-95K |
0.64% |
0.31% |
210.35 |
|
| £95-100K |
0.54% |
0.25% |
215.96 |
|
| £100K + |
3.37% |
1.34% |
250.41 |
|
|
|

|


|
1992-1997
|
1997-2001
|
|
|
|
| Con |
-10.29% |
| Lab |
10.72% |
| LD |
-1.40% |
|
| Con |
-1.02% |
| Lab |
-11.15% |
| LD |
5.47% |
|
|
 |
Frank Dobson
Labour hold
|
| Con |
 |
5,258 |
16.89% |
| Lab |
 |
16,770 |
53.87% |
| LD |
 |
5,595 |
17.97% |
| Oth |
 |
3,506 |
11.26% |
| Maj |
 |
11,175 |
35.90% |
| Turn |
 |
31,129 |
49.56% |
|
|
 |
Frank Dobson
Labour hold
|
| SL |
Joti Brar |
359 |
1.15% |
| L |
Frank Dobson |
16,770 |
53.87% |
| LD |
Nathaniel Green |
5,595 |
17.97% |
| UK |
Magnus Nielsen |
301 |
0.97% |
| C |
Roseanne Serelli |
5,258 |
16.89% |
| SA |
Candy Udwin |
971 |
3.12% |
| G |
Rob Whitley |
1,875 |
6.02% |
|
Candidates representing 7 parties stood for election to this seat.
|
|
 |
Frank Dobson
Labour
|
| Con |
 |
6,804 |
17.91% |
| Lab |
 |
24,707 |
65.02% |
| LD |
 |
4,750 |
12.50% |
| Ref |
 |
790 |
2.08% |
| Oth |
 |
946 |
2.49% |
| Maj |
 |
17,903 |
47.12% |
| Turn |
 |
37,997 |
60.28% |
|
|
 |
|
Labour
|
| Con |
 |
10,590 |
28.20% |
| Lab |
 |
20,377 |
54.30% |
| LD |
 |
5,213 |
13.90% |
| Oth |
 |
1,380 |
3.70% |
| Maj |
 |
9,787 |
26.10% |
| Turn |
 |
37,560 |
61.77% |
|
|
 |
|

|

