|
Hornchurch
Labour hold

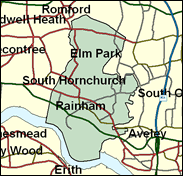
The southernmost constituency in the Outer East London Borough of Havering is the most strongly Labour of the three, and hence the least likely to return to the Conservatives next time. This pattern was repeated in the two major tests of electoral opinion since the last General Election. In the May 1998 local elections, the picture was distorted by strong and successful Residents Association candidates, but Labour was still clearly in first place; in the Euro-elections within the seat (the votes were added up and applied to a regional list) the Conservatives were ahead, but Labour came closer than in the other two Havering seats, Upminster and Romford. If Labour wins the General Election expected in 2001, the Left-winger John Cryer, both of whose parents have been MPs, should hold on.

John Cryer is a radical chip off two hard left blocks - his mother, Ann Cryer MP, and his late father Bob Cryer MP. Elected here in 1997, he has disloyally turned up for most of the Campaign Group-led revolts against the Government, on lone parent benefits, pensions, jury trials, air traffic control privatisation and incapacity benefits. A journalist, born 1964, educated at Oakbank School, Keighley, Hatfield Polytechnic and the London College of Printing, he opposes a single European currency and PR. Very few new MPs joined Campaign in 1997; he was one of them.
 |
| Wealthy Achievers, Suburban Areas |
2.63% |
14.99% |
17.52 |
|
| Affluent Greys, Rural Communities |
0.00% |
2.13% |
0.00 |
|
| Prosperous Pensioners, Retirement Areas |
0.95% |
2.49% |
38.17 |
|
| Affluent Executives, Family Areas |
0.58% |
4.43% |
13.10 |
|
| Well-Off Workers, Family Areas |
10.25% |
7.27% |
140.92 |
|
| Affluent Urbanites, Town & City Areas |
1.62% |
2.56% |
63.19 |
|
| Prosperous Professionals, Metropolitan Areas |
0.08% |
2.04% |
3.75 |
|
| Better-Off Executives, Inner City Areas |
0.11% |
3.94% |
2.72 |
|
| Comfortable Middle Agers, Mature Home Owning Areas |
39.97% |
13.04% |
306.57 |
|
| Skilled Workers, Home Owning Areas |
25.70% |
12.70% |
202.35 |
|
| New Home Owners, Mature Communities |
7.22% |
8.14% |
88.64 |
|
| White Collar Workers, Better-Off Multi Ethnic Areas |
2.76% |
4.02% |
68.53 |
|
| Older People, Less Prosperous Areas |
3.33% |
3.19% |
104.60 |
|
| Council Estate Residents, Better-Off Homes |
3.14% |
11.31% |
27.79 |
|
| Council Estate Residents, High Unemployment |
1.66% |
3.06% |
54.30 |
|
| Council Estate Residents, Greatest Hardship |
0.00% |
2.52% |
0.00 |
|
| People in Multi-Ethnic, Low-Income Areas |
0.00% |
2.10% |
0.00 |
|
| Unclassified |
0.00% |
0.06% |
0.00 |
|
|
 |
 |
 |
| £0-5K |
6.23% |
9.41% |
66.22 |
|
| £5-10K |
12.47% |
16.63% |
74.96 |
|
| £10-15K |
14.35% |
16.58% |
86.55 |
|
| £15-20K |
13.26% |
13.58% |
97.61 |
|
| £20-25K |
11.15% |
10.39% |
107.24 |
|
| £25-30K |
8.96% |
7.77% |
115.28 |
|
| £30-35K |
7.06% |
5.79% |
121.81 |
|
| £35-40K |
5.50% |
4.33% |
127.03 |
|
| £40-45K |
4.28% |
3.27% |
131.13 |
|
| £45-50K |
3.33% |
2.48% |
134.29 |
|
| £50-55K |
2.60% |
1.90% |
136.70 |
|
| £55-60K |
2.04% |
1.47% |
138.47 |
|
| £60-65K |
1.61% |
1.15% |
139.73 |
|
| £65-70K |
1.27% |
0.91% |
140.58 |
|
| £70-75K |
1.01% |
0.72% |
141.10 |
|
| £75-80K |
0.81% |
0.57% |
141.33 |
|
| £80-85K |
0.65% |
0.46% |
141.35 |
|
| £85-90K |
0.53% |
0.37% |
141.19 |
|
| £90-95K |
0.43% |
0.31% |
140.88 |
|
| £95-100K |
0.35% |
0.25% |
140.45 |
|
| £100K + |
1.82% |
1.34% |
135.14 |
|
|
|

|


|
1992-1997
|
1997-2001
|
|
|
|
| Con |
-16.21% |
| Lab |
15.72% |
| LD |
-3.26% |
|
| Con |
4.98% |
| Lab |
-3.77% |
| LD |
0.39% |
|
|
 |
John Cryer
Labour hold
|
| Con |
 |
15,032 |
42.28% |
| Lab |
 |
16,514 |
46.44% |
| LD |
 |
2,928 |
8.23% |
| Oth |
 |
1,083 |
3.05% |
| Maj |
 |
1,482 |
4.17% |
| Turn |
 |
35,557 |
58.28% |
|
|
 |
John Cryer
Labour hold
|
| L |
John Cryer |
16,514 |
46.44% |
| TD |
David Durant |
190 |
0.53% |
| LD |
Sarah Lea |
2,928 |
8.23% |
| C |
Robin Squire |
15,032 |
42.28% |
| UK |
Lawrence Webb |
893 |
2.51% |
|
Candidates representing 5 parties stood for election to this seat.
|
|
 |
John Cryer
Labour gain
|
| Con |
 |
16,386 |
37.29% |
| Lab |
 |
22,066 |
50.22% |
| LD |
 |
3,446 |
7.84% |
| Ref |
 |
1,595 |
3.63% |
| Oth |
 |
448 |
1.02% |
| Maj |
 |
5,680 |
12.93% |
| Turn |
 |
43,941 |
72.30% |
|
|
 |
|
Conservative
|
| Con |
 |
25,817 |
53.50% |
| Lab |
 |
16,652 |
34.50% |
| LD |
 |
5,366 |
11.10% |
| Oth |
 |
453 |
0.90% |
| Maj |
 |
9,165 |
19.00% |
| Turn |
 |
48,288 |
78.51% |
|
|
 |
|

|

