|
Horsham
Conservative hold

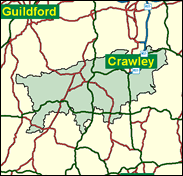
Francis Maude, the MP for the safe Horsham seat, has been widely tipped as a potential leader for the Conservative Party should they remove William Hague after another thrashing. Horsham has the fifth highest majority of any Tory seat. With an absolute majority of over 50 per cent of the vote not even maximum tactical voting could dislodge Maude from this affluent, low unemployment, 99 per cent white, two thirds middle class division in almost entirely Conservative West Sussex; perhaps not the best base from which to lead a One Nation Tory revival to recapture Middle Britain.

Francis Maude, one of 19 offspring of MPs in the current House, as son of the late Angus Maude, rightwing Suez rebel and Thatcherite of the first hour, was elected here in 1997, having earlier been MP for North Warwickshire 1983-92. Born in 1953 and educated at Abingdon School and Corpus Christi College, Cambridge, currently Shadow Foreign Secretary, a barrister and former director of his friend Archie Norman MP's ASDA Group, his Euroscepticism sits awkwardly with his signature of the Maastricht Treaty as a Treasury Minister in 1991. Not without prospects as a dark horse, despite being uncharismatic and outclassed at the dispatch box by Chancellor Brown, as Shadow Chancellor 1998-2000 he foresees a future homosexual Tory leader - his own homosexual brother having died of AIDS.
 |
| Wealthy Achievers, Suburban Areas |
40.08% |
14.99% |
267.33 |
|
| Affluent Greys, Rural Communities |
0.69% |
2.13% |
32.29 |
|
| Prosperous Pensioners, Retirement Areas |
2.83% |
2.49% |
113.90 |
|
| Affluent Executives, Family Areas |
13.40% |
4.43% |
302.84 |
|
| Well-Off Workers, Family Areas |
11.67% |
7.27% |
160.51 |
|
| Affluent Urbanites, Town & City Areas |
2.17% |
2.56% |
84.71 |
|
| Prosperous Professionals, Metropolitan Areas |
1.35% |
2.04% |
66.22 |
|
| Better-Off Executives, Inner City Areas |
0.67% |
3.94% |
17.00 |
|
| Comfortable Middle Agers, Mature Home Owning Areas |
14.76% |
13.04% |
113.19 |
|
| Skilled Workers, Home Owning Areas |
3.35% |
12.70% |
26.39 |
|
| New Home Owners, Mature Communities |
3.68% |
8.14% |
45.23 |
|
| White Collar Workers, Better-Off Multi Ethnic Areas |
0.51% |
4.02% |
12.65 |
|
| Older People, Less Prosperous Areas |
1.55% |
3.19% |
48.54 |
|
| Council Estate Residents, Better-Off Homes |
3.07% |
11.31% |
27.16 |
|
| Council Estate Residents, High Unemployment |
0.09% |
3.06% |
3.06 |
|
| Council Estate Residents, Greatest Hardship |
0.00% |
2.52% |
0.00 |
|
| People in Multi-Ethnic, Low-Income Areas |
0.00% |
2.10% |
0.00 |
|
| Unclassified |
0.11% |
0.06% |
182.06 |
|
|
 |
 |
 |
| £0-5K |
4.10% |
9.41% |
43.55 |
|
| £5-10K |
9.47% |
16.63% |
56.95 |
|
| £10-15K |
12.12% |
16.58% |
73.11 |
|
| £15-20K |
12.19% |
13.58% |
89.74 |
|
| £20-25K |
10.98% |
10.39% |
105.68 |
|
| £25-30K |
9.36% |
7.77% |
120.39 |
|
| £30-35K |
7.74% |
5.79% |
133.66 |
|
| £35-40K |
6.30% |
4.33% |
145.47 |
|
| £40-45K |
5.09% |
3.27% |
155.91 |
|
| £45-50K |
4.10% |
2.48% |
165.10 |
|
| £50-55K |
3.30% |
1.90% |
173.17 |
|
| £55-60K |
2.66% |
1.47% |
180.26 |
|
| £60-65K |
2.15% |
1.15% |
186.49 |
|
| £65-70K |
1.74% |
0.91% |
191.97 |
|
| £70-75K |
1.42% |
0.72% |
196.80 |
|
| £75-80K |
1.16% |
0.57% |
201.06 |
|
| £80-85K |
0.95% |
0.46% |
204.84 |
|
| £85-90K |
0.78% |
0.37% |
208.19 |
|
| £90-95K |
0.64% |
0.31% |
211.17 |
|
| £95-100K |
0.53% |
0.25% |
213.83 |
|
| £100K + |
3.01% |
1.34% |
224.06 |
|
|
|

|


|
1992-1997
|
1997-2001
|
|
|
|
| Con |
-11.54% |
| Lab |
6.80% |
| LD |
1.96% |
|
| Con |
0.72% |
| Lab |
1.52% |
| LD |
-0.20% |
|
|
 |
Francis Maude
Conservative hold
|
| Con |
 |
26,134 |
51.48% |
| Lab |
 |
10,267 |
20.22% |
| LD |
 |
12,468 |
24.56% |
| Oth |
 |
1,901 |
3.74% |
| Maj |
 |
13,666 |
26.92% |
| Turn |
 |
50,770 |
63.78% |
|
|
 |
Francis Maude
Conservative hold
|
| LD |
Hubert Carr |
12,468 |
24.56% |
| I |
Jim Duggan |
429 |
0.84% |
| C |
Francis Maude |
26,134 |
51.48% |
| UK |
Hugo Miller |
1,472 |
2.90% |
| L |
Janet Sully |
10,267 |
20.22% |
|
Candidates representing 5 parties stood for election to this seat.
|
|
 |
Francis Maude
Conservative
|
| Con |
 |
29,015 |
50.76% |
| Lab |
 |
10,691 |
18.70% |
| LD |
 |
14,153 |
24.76% |
| Ref |
 |
2,281 |
3.99% |
| Oth |
 |
1,025 |
1.79% |
| Maj |
 |
14,862 |
26.00% |
| Turn |
 |
57,165 |
75.78% |
|
|
 |
|
Conservative
|
| Con |
 |
35,769 |
62.30% |
| Lab |
 |
6,858 |
11.90% |
| LD |
 |
13,078 |
22.80% |
| Oth |
 |
1,704 |
3.00% |
| Maj |
 |
22,691 |
39.50% |
| Turn |
 |
57,409 |
79.75% |
|
|
 |
|

|

