|
Houghton & Washington East
Labour hold

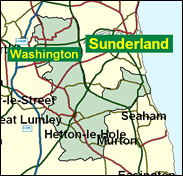
One of Labour's 13 safest seats is this County Durham mixture of old heavy industry ex-mining areas such as Houghton-le-Spring and Hetton-le-Hole with that half of the gritty, windy, barren Washington New Town not included with Gateshead East.

Labour's Fraser Kemp, was elected in 1997 after a career as a party apparatchik, masterminding two big by-election victories at Mid Staffordshire and Dudley West in the early 1990s. A Durham miner's son, born 1958, he attended Washington Comprehensive School. Tall, balding and convivial, he favours regional assemblies but not PR, which he rightly sees as destroying a 177-strong Labour majority. He sees the biggest betrayal of the working class as indulging in "intellectual masturbation" and losing elections.
 |
| Wealthy Achievers, Suburban Areas |
0.54% |
14.99% |
3.59 |
|
| Affluent Greys, Rural Communities |
0.00% |
2.13% |
0.00 |
|
| Prosperous Pensioners, Retirement Areas |
0.00% |
2.49% |
0.00 |
|
| Affluent Executives, Family Areas |
1.47% |
4.43% |
33.24 |
|
| Well-Off Workers, Family Areas |
13.48% |
7.27% |
185.26 |
|
| Affluent Urbanites, Town & City Areas |
0.73% |
2.56% |
28.48 |
|
| Prosperous Professionals, Metropolitan Areas |
0.00% |
2.04% |
0.00 |
|
| Better-Off Executives, Inner City Areas |
0.29% |
3.94% |
7.40 |
|
| Comfortable Middle Agers, Mature Home Owning Areas |
4.36% |
13.04% |
33.40 |
|
| Skilled Workers, Home Owning Areas |
21.00% |
12.70% |
165.34 |
|
| New Home Owners, Mature Communities |
18.42% |
8.14% |
226.22 |
|
| White Collar Workers, Better-Off Multi Ethnic Areas |
0.00% |
4.02% |
0.00 |
|
| Older People, Less Prosperous Areas |
3.91% |
3.19% |
122.74 |
|
| Council Estate Residents, Better-Off Homes |
28.12% |
11.31% |
248.59 |
|
| Council Estate Residents, High Unemployment |
0.83% |
3.06% |
26.98 |
|
| Council Estate Residents, Greatest Hardship |
6.75% |
2.52% |
267.90 |
|
| People in Multi-Ethnic, Low-Income Areas |
0.00% |
2.10% |
0.00 |
|
| Unclassified |
0.11% |
0.06% |
182.20 |
|
|
 |
|
|
| £0-5K |
13.63% |
9.41% |
144.81 |
|
| £5-10K |
21.28% |
16.63% |
127.92 |
|
| £10-15K |
18.95% |
16.58% |
114.31 |
|
| £15-20K |
13.99% |
13.58% |
103.01 |
|
| £20-25K |
9.70% |
10.39% |
93.36 |
|
| £25-30K |
6.61% |
7.77% |
85.02 |
|
| £30-35K |
4.50% |
5.79% |
77.76 |
|
| £35-40K |
3.09% |
4.33% |
71.43 |
|
| £40-45K |
2.15% |
3.27% |
65.88 |
|
| £45-50K |
1.51% |
2.48% |
61.01 |
|
| £50-55K |
1.08% |
1.90% |
56.71 |
|
| £55-60K |
0.78% |
1.47% |
52.91 |
|
| £60-65K |
0.57% |
1.15% |
49.54 |
|
| £65-70K |
0.42% |
0.91% |
46.53 |
|
| £70-75K |
0.32% |
0.72% |
43.84 |
|
| £75-80K |
0.24% |
0.57% |
41.43 |
|
| £80-85K |
0.18% |
0.46% |
39.26 |
|
| £85-90K |
0.14% |
0.37% |
37.29 |
|
| £90-95K |
0.11% |
0.31% |
35.51 |
|
| £95-100K |
0.08% |
0.25% |
33.89 |
|
| £100K + |
0.36% |
1.34% |
26.61 |
|
|
|
|


|
1992-1997
|
1997-2001
|
|
|
|
| Con |
-8.81% |
| Lab |
9.38% |
| LD |
-3.63% |
|
| Con |
1.41% |
| Lab |
-3.18% |
| LD |
4.82% |
|
|
|
Fraser Kemp
Labour hold
|
| Con |
 |
4,810 |
14.30% |
| Lab |
 |
24,628 |
73.21% |
| LD |
 |
4,203 |
12.49% |
| Oth |
|
0 |
0.00% |
| Maj |
 |
19,818 |
58.91% |
| Turn |
|
33,641 |
49.51% |
|
|
|
Fraser Kemp
Labour hold
|
| C |
Tony Devenish |
4,810 |
14.30% |
| L |
Fraser Kemp |
24,628 |
73.21% |
| LD |
Richard Ormerod |
4,203 |
12.49% |
|
Candidates representing 3 parties stood for election to this seat.
|
|
|
Fraser Kemp
Labour
|
| Con |
|
5,391 |
12.89% |
| Lab |
|
31,946 |
76.38% |
| LD |
|
3,209 |
7.67% |
| Ref |
 |
1,277 |
3.05% |
| Oth |
|
0 |
0.00% |
| Maj |
|
26,555 |
63.49% |
| Turn |
|
41,823 |
62.10% |
|
|
|
|
Labour
|
| Con |
|
10,046 |
21.70% |
| Lab |
|
30,995 |
67.00% |
| LD |
|
5,221 |
11.30% |
| Oth |
|
0 |
0.00% |
| Maj |
|
20,949 |
45.30% |
| Turn |
|
46,262 |
69.38% |
|
|
|
|
|