|
Hove
Labour hold

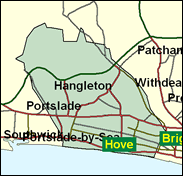
Like many south coast seats, Hove has changed in character and moved to the left, which is good news for the first-term MP Ivon Caplin. The newish unitary authority which combines Brighton and Hove (at one time proudly independent of each other but now much more indistinguishable) is controlled by Labour, who may well hold all three constituencies within its area against a declining local Conservative Party. Hove is widely redarded to have declind socially and economically, and although there are still excellent residential areas inland around Hove Park, the sea front has not entirely avoided the social security claimants, bedsit tenants, and assorted radicals so common in neighbouring Brighton Kempton and Pavilion, and there are much older working class centres of Labour support in places like Portslade near Shoreham Harbour and the council estate part of Hangleton. Caplin may well be the narrow favourite in Hove, actually.

Ivor Caplin, one of Labour's winners in the three-seat Brighton conurbation in 1997, is a staunchly on-message Blairite MP. A former local councillor and council leader, he was born locally in 1958, educated at King Edward's School, Witley and Brighton College of Technology, and worked in insurance for 20 years. He is keen on sport and animal welfare and saw his ultra-loyalty recognised in his appointment as Margaret Beckett's PPS. Conservative candidate Jenny Langston is the fifth likeliest woman to win a new seat for the Tories. Born 1950 and educated at Sussex University, atypically for a Tory she comes from a solid local government background, as an East Sussex County Councillor 1987-97, a Hove Councillor 1991-97, and a Brighton & Hove Councillor since 1996, and Deputy Group Leader 1996-99. She was Mayor of Brighton & Hove in 1999, and has specialised in education, social services and health.
 |
| Wealthy Achievers, Suburban Areas |
11.23% |
14.99% |
74.89 |
|
| Affluent Greys, Rural Communities |
0.00% |
2.13% |
0.00 |
|
| Prosperous Pensioners, Retirement Areas |
15.53% |
2.49% |
624.58 |
|
| Affluent Executives, Family Areas |
0.50% |
4.43% |
11.38 |
|
| Well-Off Workers, Family Areas |
2.68% |
7.27% |
36.85 |
|
| Affluent Urbanites, Town & City Areas |
5.49% |
2.56% |
214.04 |
|
| Prosperous Professionals, Metropolitan Areas |
3.75% |
2.04% |
183.73 |
|
| Better-Off Executives, Inner City Areas |
15.78% |
3.94% |
400.12 |
|
| Comfortable Middle Agers, Mature Home Owning Areas |
17.94% |
13.04% |
137.58 |
|
| Skilled Workers, Home Owning Areas |
7.65% |
12.70% |
60.25 |
|
| New Home Owners, Mature Communities |
4.18% |
8.14% |
51.39 |
|
| White Collar Workers, Better-Off Multi Ethnic Areas |
5.65% |
4.02% |
140.37 |
|
| Older People, Less Prosperous Areas |
1.42% |
3.19% |
44.72 |
|
| Council Estate Residents, Better-Off Homes |
5.35% |
11.31% |
47.26 |
|
| Council Estate Residents, High Unemployment |
2.44% |
3.06% |
79.55 |
|
| Council Estate Residents, Greatest Hardship |
0.41% |
2.52% |
16.29 |
|
| People in Multi-Ethnic, Low-Income Areas |
0.00% |
2.10% |
0.00 |
|
| Unclassified |
0.00% |
0.06% |
0.00 |
|
|
 |
 |
 |
| £0-5K |
8.56% |
9.41% |
90.93 |
|
| £5-10K |
15.25% |
16.63% |
91.66 |
|
| £10-15K |
15.85% |
16.58% |
95.59 |
|
| £15-20K |
13.51% |
13.58% |
99.46 |
|
| £20-25K |
10.67% |
10.39% |
102.68 |
|
| £25-30K |
8.18% |
7.77% |
105.21 |
|
| £30-35K |
6.21% |
5.79% |
107.17 |
|
| £35-40K |
4.71% |
4.33% |
108.66 |
|
| £40-45K |
3.59% |
3.27% |
109.80 |
|
| £45-50K |
2.75% |
2.48% |
110.65 |
|
| £50-55K |
2.12% |
1.90% |
111.29 |
|
| £55-60K |
1.65% |
1.47% |
111.74 |
|
| £60-65K |
1.29% |
1.15% |
112.06 |
|
| £65-70K |
1.02% |
0.91% |
112.27 |
|
| £70-75K |
0.81% |
0.72% |
112.38 |
|
| £75-80K |
0.65% |
0.57% |
112.42 |
|
| £80-85K |
0.52% |
0.46% |
112.39 |
|
| £85-90K |
0.42% |
0.37% |
112.31 |
|
| £90-95K |
0.34% |
0.31% |
112.18 |
|
| £95-100K |
0.28% |
0.25% |
112.01 |
|
| £100K + |
1.48% |
1.34% |
109.79 |
|
|
|

|


|
1992-1997
|
1997-2001
|
|
|
|
| Con |
-12.64% |
| Lab |
20.09% |
| LD |
-9.75% |
|
| Con |
1.94% |
| Lab |
1.26% |
| LD |
-0.55% |
|
|
 |
Ivor Caplin
Labour hold
|
| Con |
 |
16,082 |
38.30% |
| Lab |
 |
19,253 |
45.85% |
| LD |
 |
3,823 |
9.10% |
| Oth |
 |
2,830 |
6.74% |
| Maj |
 |
3,171 |
7.55% |
| Turn |
 |
41,988 |
59.23% |
|
|
 |
Ivor Caplin
Labour hold
|
| G |
Anthea Ballam |
1,369 |
3.26% |
| L |
Ivor Caplin |
19,253 |
45.85% |
| LD |
Harold de Souza |
3,823 |
9.10% |
| FP |
Simon Dobbshead |
196 |
0.47% |
| LIB |
Nigel Donovan |
316 |
0.75% |
| UK |
Richard Franklin |
358 |
0.85% |
| C |
Jenny Langston |
16,082 |
38.30% |
| I |
Thomas Major |
60 |
0.14% |
| SA |
Andy Richards |
531 |
1.26% |
|
Candidates representing 9 parties stood for election to this seat.
|
|
 |
Ivor Caplin
Labour gain
|
| Con |
 |
17,499 |
36.36% |
| Lab |
 |
21,458 |
44.59% |
| LD |
 |
4,645 |
9.65% |
| Ref |
 |
1,931 |
4.01% |
| Oth |
 |
2,588 |
5.38% |
| Maj |
 |
3,959 |
8.23% |
| Turn |
 |
48,121 |
69.72% |
|
|
 |
|
Conservative
|
| Con |
 |
24,525 |
49.00% |
| Lab |
 |
12,257 |
24.50% |
| LD |
 |
9,709 |
19.40% |
| Oth |
 |
3,598 |
7.20% |
| Maj |
 |
12,268 |
24.50% |
| Turn |
 |
50,089 |
72.29% |
|
|
 |
|

|

