|
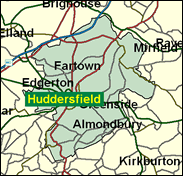
Huddersfield
Labour hold

A proud and independent West Yorkshire town, once a woollen metropolis and once boasting two seats, Huddersfield has now lost to Colne Valley its west end, which used to claim more millionaires per square mile than anywhere else in the industrial North of England (the actor James Mason was a local textile magnate's son, and the Headmaster for decades of the excellent boys grammar school, Huddersfield New College, was H E Atkins, British chess champion for decades too). What remains is a solid Labour seat based on the old East constituency, with some Liberal Democrat local activity in Kirklees Borough elections, in which Labour does not shine as they do in national government contests.

Barry Sheerman, born 1940, educated at Hampton Grammar School and LSE, has been MP for Huddersfield since 1979, before which he was a Swansea-based politics lecturer for 13 years. A Hattersley-linked frontbencher in the eighties, who did not long survive his patron's retirement as Deputy Leader in 1992, he has latterly re-emerged as Chairman of the Education Select Committee from which vantage point he mades NUT-soothing assaults on HMI Chris Woodhead and populist attacks on Oxford's allegedly discriminating entrance procedures (claiming Oxford and Cambridge "are not as good as they think they are"; whilst of him it has been said "not as bright as he thinks he is"). Unkindly dubbed "an ageing crawler" (M Parris, The Times) he is a Europhile Blairite loyalist, who has never strayed from centre-right affiliations in his party.
 |
| Wealthy Achievers, Suburban Areas |
7.64% |
14.99% |
50.92 |
|
| Affluent Greys, Rural Communities |
0.00% |
2.13% |
0.00 |
|
| Prosperous Pensioners, Retirement Areas |
0.02% |
2.49% |
0.82 |
|
| Affluent Executives, Family Areas |
2.09% |
4.43% |
47.16 |
|
| Well-Off Workers, Family Areas |
4.07% |
7.27% |
55.97 |
|
| Affluent Urbanites, Town & City Areas |
2.56% |
2.56% |
99.66 |
|
| Prosperous Professionals, Metropolitan Areas |
0.00% |
2.04% |
0.00 |
|
| Better-Off Executives, Inner City Areas |
3.19% |
3.94% |
80.76 |
|
| Comfortable Middle Agers, Mature Home Owning Areas |
5.72% |
13.04% |
43.87 |
|
| Skilled Workers, Home Owning Areas |
18.29% |
12.70% |
144.01 |
|
| New Home Owners, Mature Communities |
7.94% |
8.14% |
97.48 |
|
| White Collar Workers, Better-Off Multi Ethnic Areas |
5.43% |
4.02% |
134.91 |
|
| Older People, Less Prosperous Areas |
7.19% |
3.19% |
225.68 |
|
| Council Estate Residents, Better-Off Homes |
23.25% |
11.31% |
205.57 |
|
| Council Estate Residents, High Unemployment |
3.35% |
3.06% |
109.35 |
|
| Council Estate Residents, Greatest Hardship |
3.28% |
2.52% |
130.43 |
|
| People in Multi-Ethnic, Low-Income Areas |
5.92% |
2.10% |
281.82 |
|
| Unclassified |
0.08% |
0.06% |
122.04 |
|
|
 |
|
|
| £0-5K |
13.36% |
9.41% |
141.90 |
|
| £5-10K |
19.98% |
16.63% |
120.15 |
|
| £10-15K |
17.95% |
16.58% |
108.29 |
|
| £15-20K |
13.56% |
13.58% |
99.79 |
|
| £20-25K |
9.67% |
10.39% |
93.09 |
|
| £25-30K |
6.81% |
7.77% |
87.59 |
|
| £30-35K |
4.81% |
5.79% |
83.00 |
|
| £35-40K |
3.43% |
4.33% |
79.15 |
|
| £40-45K |
2.48% |
3.27% |
75.88 |
|
| £45-50K |
1.81% |
2.48% |
73.09 |
|
| £50-55K |
1.35% |
1.90% |
70.69 |
|
| £55-60K |
1.01% |
1.47% |
68.62 |
|
| £60-65K |
0.77% |
1.15% |
66.81 |
|
| £65-70K |
0.59% |
0.91% |
65.23 |
|
| £70-75K |
0.46% |
0.72% |
63.84 |
|
| £75-80K |
0.36% |
0.57% |
62.59 |
|
| £80-85K |
0.28% |
0.46% |
61.48 |
|
| £85-90K |
0.23% |
0.37% |
60.48 |
|
| £90-95K |
0.18% |
0.31% |
59.57 |
|
| £95-100K |
0.15% |
0.25% |
58.75 |
|
| £100K + |
0.73% |
1.34% |
54.63 |
|
|
|
|


|
1992-1997
|
1997-2001
|
|
|
|
| Con |
-12.97% |
| Lab |
7.80% |
| LD |
1.25% |
|
| Con |
3.93% |
| Lab |
-3.25% |
| LD |
-2.17% |
|
|
|
Barry Sheerman
Labour hold
|
| Con |
 |
8,794 |
24.85% |
| Lab |
 |
18,840 |
53.25% |
| LD |
 |
5,300 |
14.98% |
| Oth |
 |
2,449 |
6.92% |
| Maj |
 |
10,046 |
28.39% |
| Turn |
|
35,383 |
54.99% |
|
|
|
Barry Sheerman
Labour hold
|
| C |
Paul Baverstock |
8,794 |
24.85% |
| LD |
Neil Bentley |
5,300 |
14.98% |
| SA |
Graham Hellawell |
374 |
1.06% |
| UK |
Judith Longman |
613 |
1.73% |
| G |
John Phillips |
1,254 |
3.54% |
| SL |
George Randall |
208 |
0.59% |
| LC |
Barry Sheerman |
18,840 |
53.25% |
|
Candidates representing 7 parties stood for election to this seat.
|
|
|
Bary Sheerman
Labour
|
| Con |
|
9,323 |
20.93% |
| Lab |
|
25,171 |
56.50% |
| LD |
|
7,642 |
17.15% |
| Ref |
 |
1,480 |
3.32% |
| Oth |
|
938 |
2.11% |
| Maj |
|
15,848 |
35.57% |
| Turn |
|
44,554 |
67.69% |
|
|
|
|
Labour
|
| Con |
|
16,574 |
33.90% |
| Lab |
|
23,832 |
48.70% |
| LD |
|
7,777 |
15.90% |
| Oth |
|
711 |
1.50% |
| Maj |
|
7,258 |
14.80% |
| Turn |
|
48,894 |
71.55% |
|
|
|
|
|